Airfoil Design and Wind Tunnel Testing
This is an assignment on airfoil in aerospace for the AL Aerospace Engineering course at Concordia International School, conducted by Dr. Peter Tong (aka D.T). This article documents how I chose, carved, and tested an airfoil, exploring the physics phenomena behind it throughout the building process.
Objectives
To understand why and how an airfoil creates lift, to select an airfoil appropriate for a small powered model, and to carve and test foam airfoils in a wind tunnel.
Guiding Questions
- Why would an airfoil create lift?
- What is the role of the angle of attack, and what happens at stall?
- How does the Reynolds number regime constrain airfoil selection?
- How can a foam airfoil be reliably fabricated by hot-wire cutting?
- How does airflow behave around a real airfoil in a wind tunnel?
Why Would an Airfoil Create Lift
A Wrong Theory: Equal Transit Theory
The Equal Transit theory, based on Bernoulli’s principle, claims that a particle from one place reaches another place in the same time. Some particles have a longer distance and travel faster, so .
From the basic definition of pressure:
So faster flow means lower pressure, which gives , and the force at the bottom is higher than at the top. The resulting pressure distribution around a cambered airfoil is shown in Figure 1.
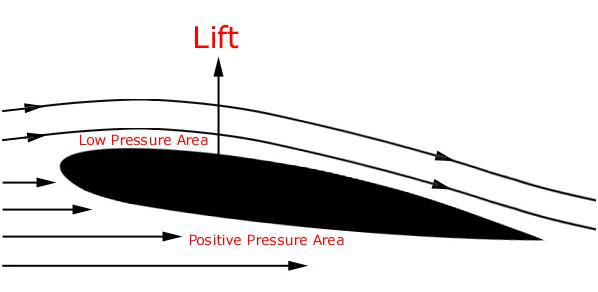 Figure 1: Streamlines around a cambered airfoil.
The theory predicts the right direction of the force, but the premise that the two particles must rejoin at the trailing edge in the same time is not actually true. Smoke-tunnel experiments show the upper particle gets there first. The real mechanism still involves a pressure difference, but it comes from curvature and flow turning, which I’ll get to below.
Parts
An airfoil contains the following parts: chord line, camber line, leading edge, max thickness, max camber, upper surface, lower surface, and trailing edge.
- Leading edge: the section of the airfoil that meets the air first.
- Trailing edge: the section of the airfoil that meets the air last.
- Upper surface: the surface of the top wing.
- Lower surface: the surface of the bottom wing.
- Chord line: the straight line from leading edge to trailing edge.
- Camber line: the curve running halfway between the upper and lower surfaces.
- Max thickness: the greatest perpendicular distance between upper and lower surfaces.
- Max camber: the greatest perpendicular distance between the chord line and the camber line.
Two main terms describe how the airfoil behaves.
Angle of Attack (AOA): the angle between the chord line of an airfoil and the relative wind. Depending on the AOA, lift can increase or decrease.
Stalling: a sudden loss of lift and increase in drag at high AOA. This usually happens around 18 degrees. Air does not always flow uniformly (turbulent flow, flow separation). The relationship of AOA with lift and drag is shown in Figure 2, where lift rises approximately linearly with AOA until stall, while drag rises throughout and accelerates near stall.
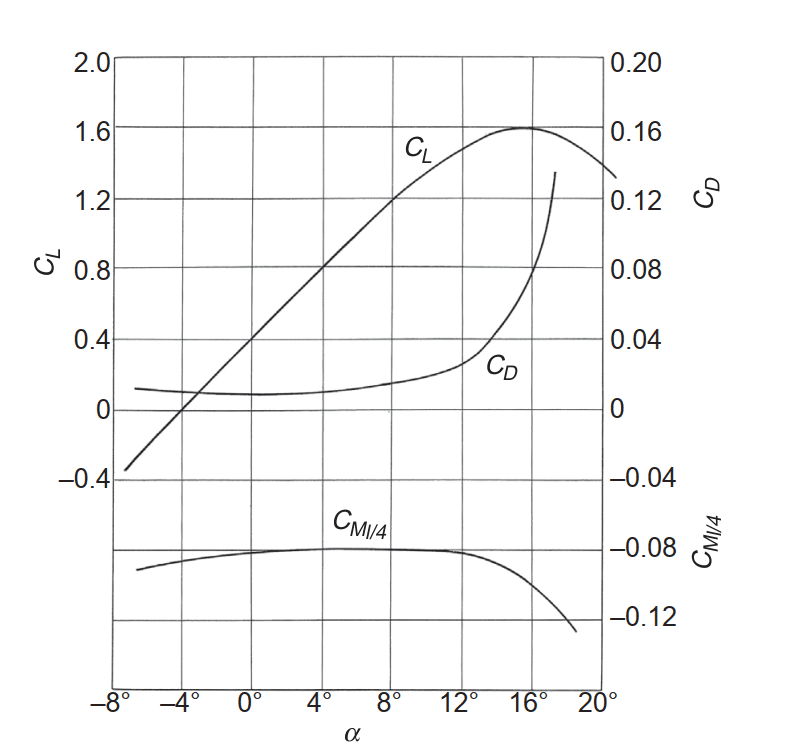 Figure 2: Graph showing the relationship of AOA with lift and drag coefficient (, ) and quarter-chord moment coefficient () plotted against angle of attack .
Drag
Drag is the force that opposes the airfoil’s motion through the air and slows down the overall speed. The full drag breakdown is shown in Figure 3. Total drag can be split into parasitic drag (interference, profile, wave) and induced drag, with profile drag further divided into skin friction and pressure (form) drag.
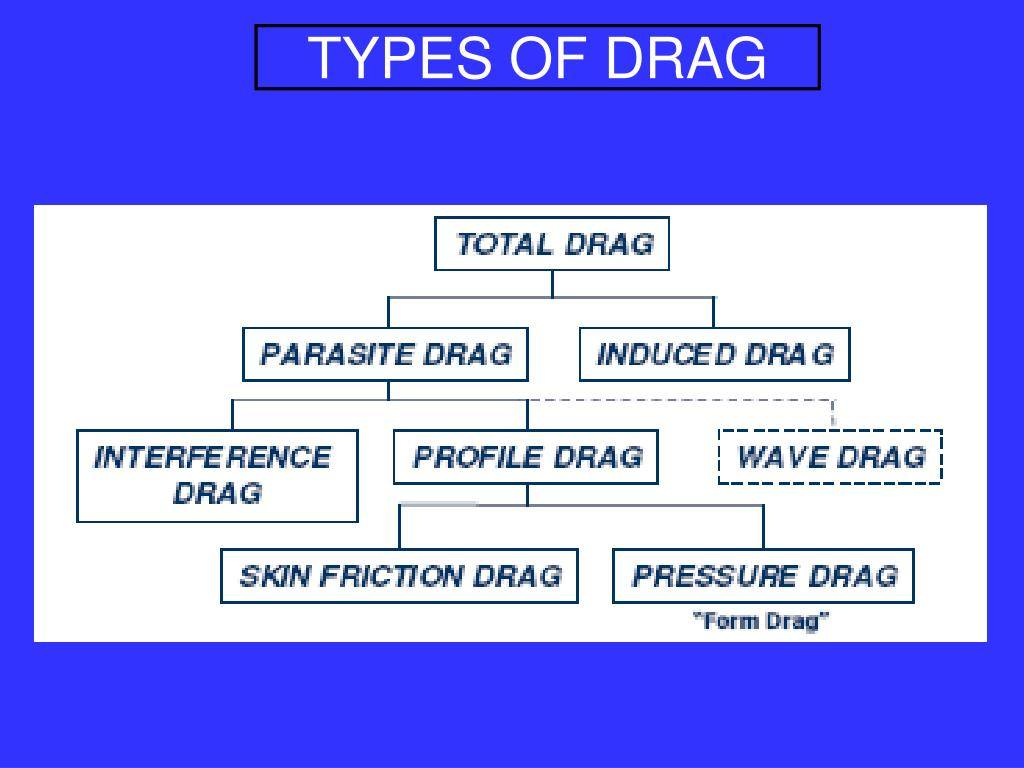 Figure 3: Classification tree of aerodynamic drag.
Why Curvature?
Curvature is what generates the pressure difference that produces lift. The pressure at the bottom is higher, and the air flows faster at the top. The intuition comes from squeezing a tube: the same amount of water has to go through, so it speeds up where the tube is narrow, and the speed of liquid flow is slower when the cross-sectional area is large. Now imagine there’s a tube around the airfoil. The upper surface curves into the tube and squeezes it, so the air there accelerates and the pressure drops. The streamtube analogy is made concrete in Figure 4. Substitute the airfoil upper surface for the narrow section of the duct.
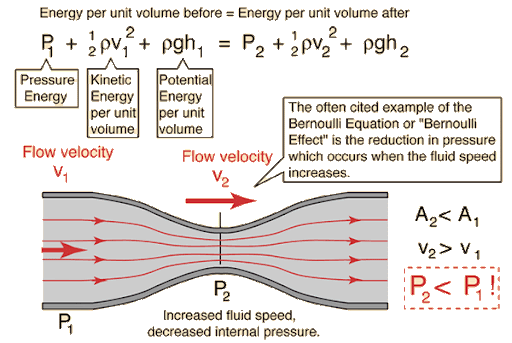
Figure 4: Bernoulli’s equation as conservation of energy per unit volume along a streamline.
The same principle is why different species of fish have different shapes. A streamlined tuna is hydrodynamic. A puffer fish is not. Different airfoil profiles work the same way, each tuned for a different mission. As shown in Figure 5, the AG455ct selected later in this article most closely matches the deep-camber thin section.
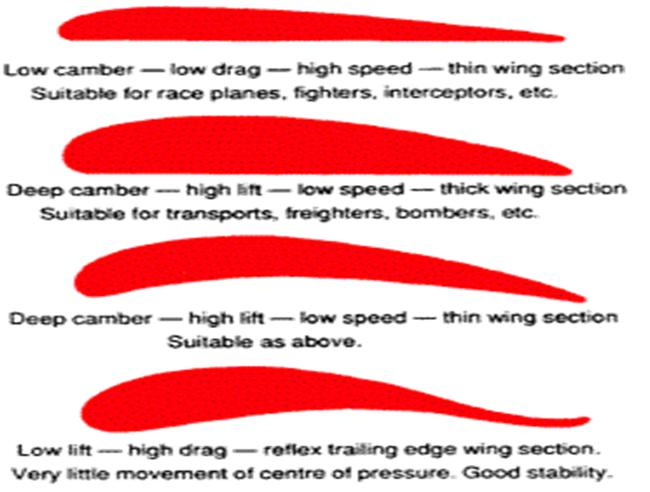 Figure 5: Four representative airfoil cross-sections and their typical applications.
Applications
The applications of airfoils are not limited to airplanes. They also show up in windmills, spoilers, sails, hydrofoils, and propeller blades. A car spoiler is a good example of the principle running in reverse. The curved part is the opposite of an airfoil, so it generates downforce instead of lift, which keeps the car pressed onto the ground at high speed.
3D End Effects
An airfoil is 2D, but a wing is 3D, which means it has ends and winglets. Since a wing has an end, the air creeps up at the end and spirals backward. Winglets typically reduce total aircraft drag by about 3% to 7% and, more specifically, can reduce lift-induced drag (vortex drag) by up to 20% (NASA, 2014). Therefore, the function of winglets is not to increase lift but to reduce drag and save fuel.
The trade-off between induced drag and parasitic drag also sets the most efficient cruise speed. As shown in Figure 6, there is a specific airspeed that minimizes total drag, which corresponds to the maximum-range cruise speed targeted by the design.
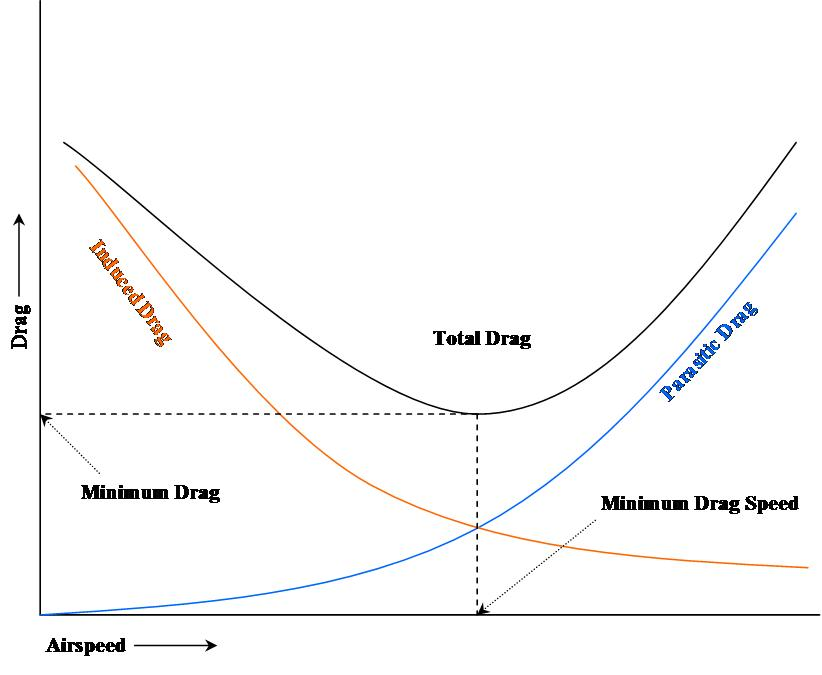 Figure 6: Drag versus airspeed.
Another 3D end-effect example is the horseshoe vortex formation around a cylinder, where the same wraparound flow pattern emerges from the body’s finite length.
The 3D nature of a wing also means it carries control surfaces. As labeled in Figure 7, the ailerons on each wing produce differential lift to control the roll when moving only those surfaces.
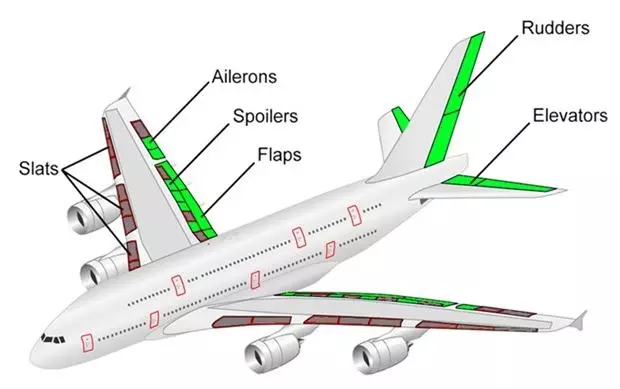 Figure 7: Annotated diagram of a commercial airliner’s aerodynamic control surfaces.
Pitot Tube
A Pitot tube measures airspeed using the same pressure-velocity relationship that gives an airfoil its lift. Specifically, it applies Bernoulli’s equation, , which states that for an inviscid, incompressible, and steady fluid flow, the total energy along a streamline remains constant. It represents the sum of static pressure (), dynamic pressure (), and hydrostatic pressure (), where higher velocity equals lower pressure (NASA Glenn Research Center, n.d.).
The equation relates pressure (), fluid density (), velocity (), gravitational acceleration (), and elevation () at two points (1 and 2) along a streamline:
- Static pressure: the actual thermodynamic pressure of the fluid.
- Dynamic pressure: kinetic energy per unit volume.
- Hydrostatic pressure: potential energy per unit volume due to gravity.
As shown in Figure 8, once the pressure of the air at a certain altitude is already known, the Pitot tube recovers velocity from the dynamic pressure term.
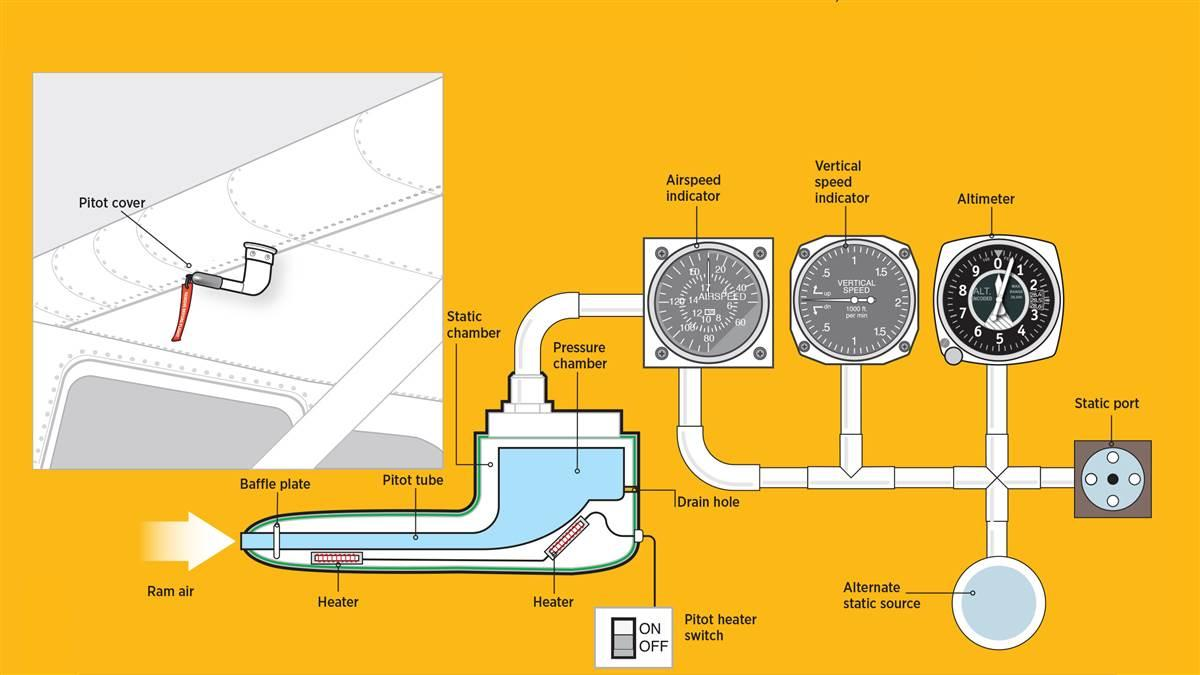 Figure 8: Pitot–static system schematic.
Foam Airfoils
With the airfoil chosen, the next step was to translate the coordinate file into a physical wing. The fabrication method was hot-wire cutting of extruded polystyrene foam (XPS), which is a standard technique for low-cost airfoil prototyping (Lennon, 1996).
Template Preparation
The airfoil coordinates were printed at full scale and glued to two thin paper templates, one for each end of the foam block. The templates were aligned to the foam by stacking them flush against the front and back faces with pushpins. Since we need 2 cuts, templates are separated into upper and lower parts on each side. As shown in Figures 9 and 10, the template was stacked on one side of the foam, with the chord line oriented horizontally relative to the table.
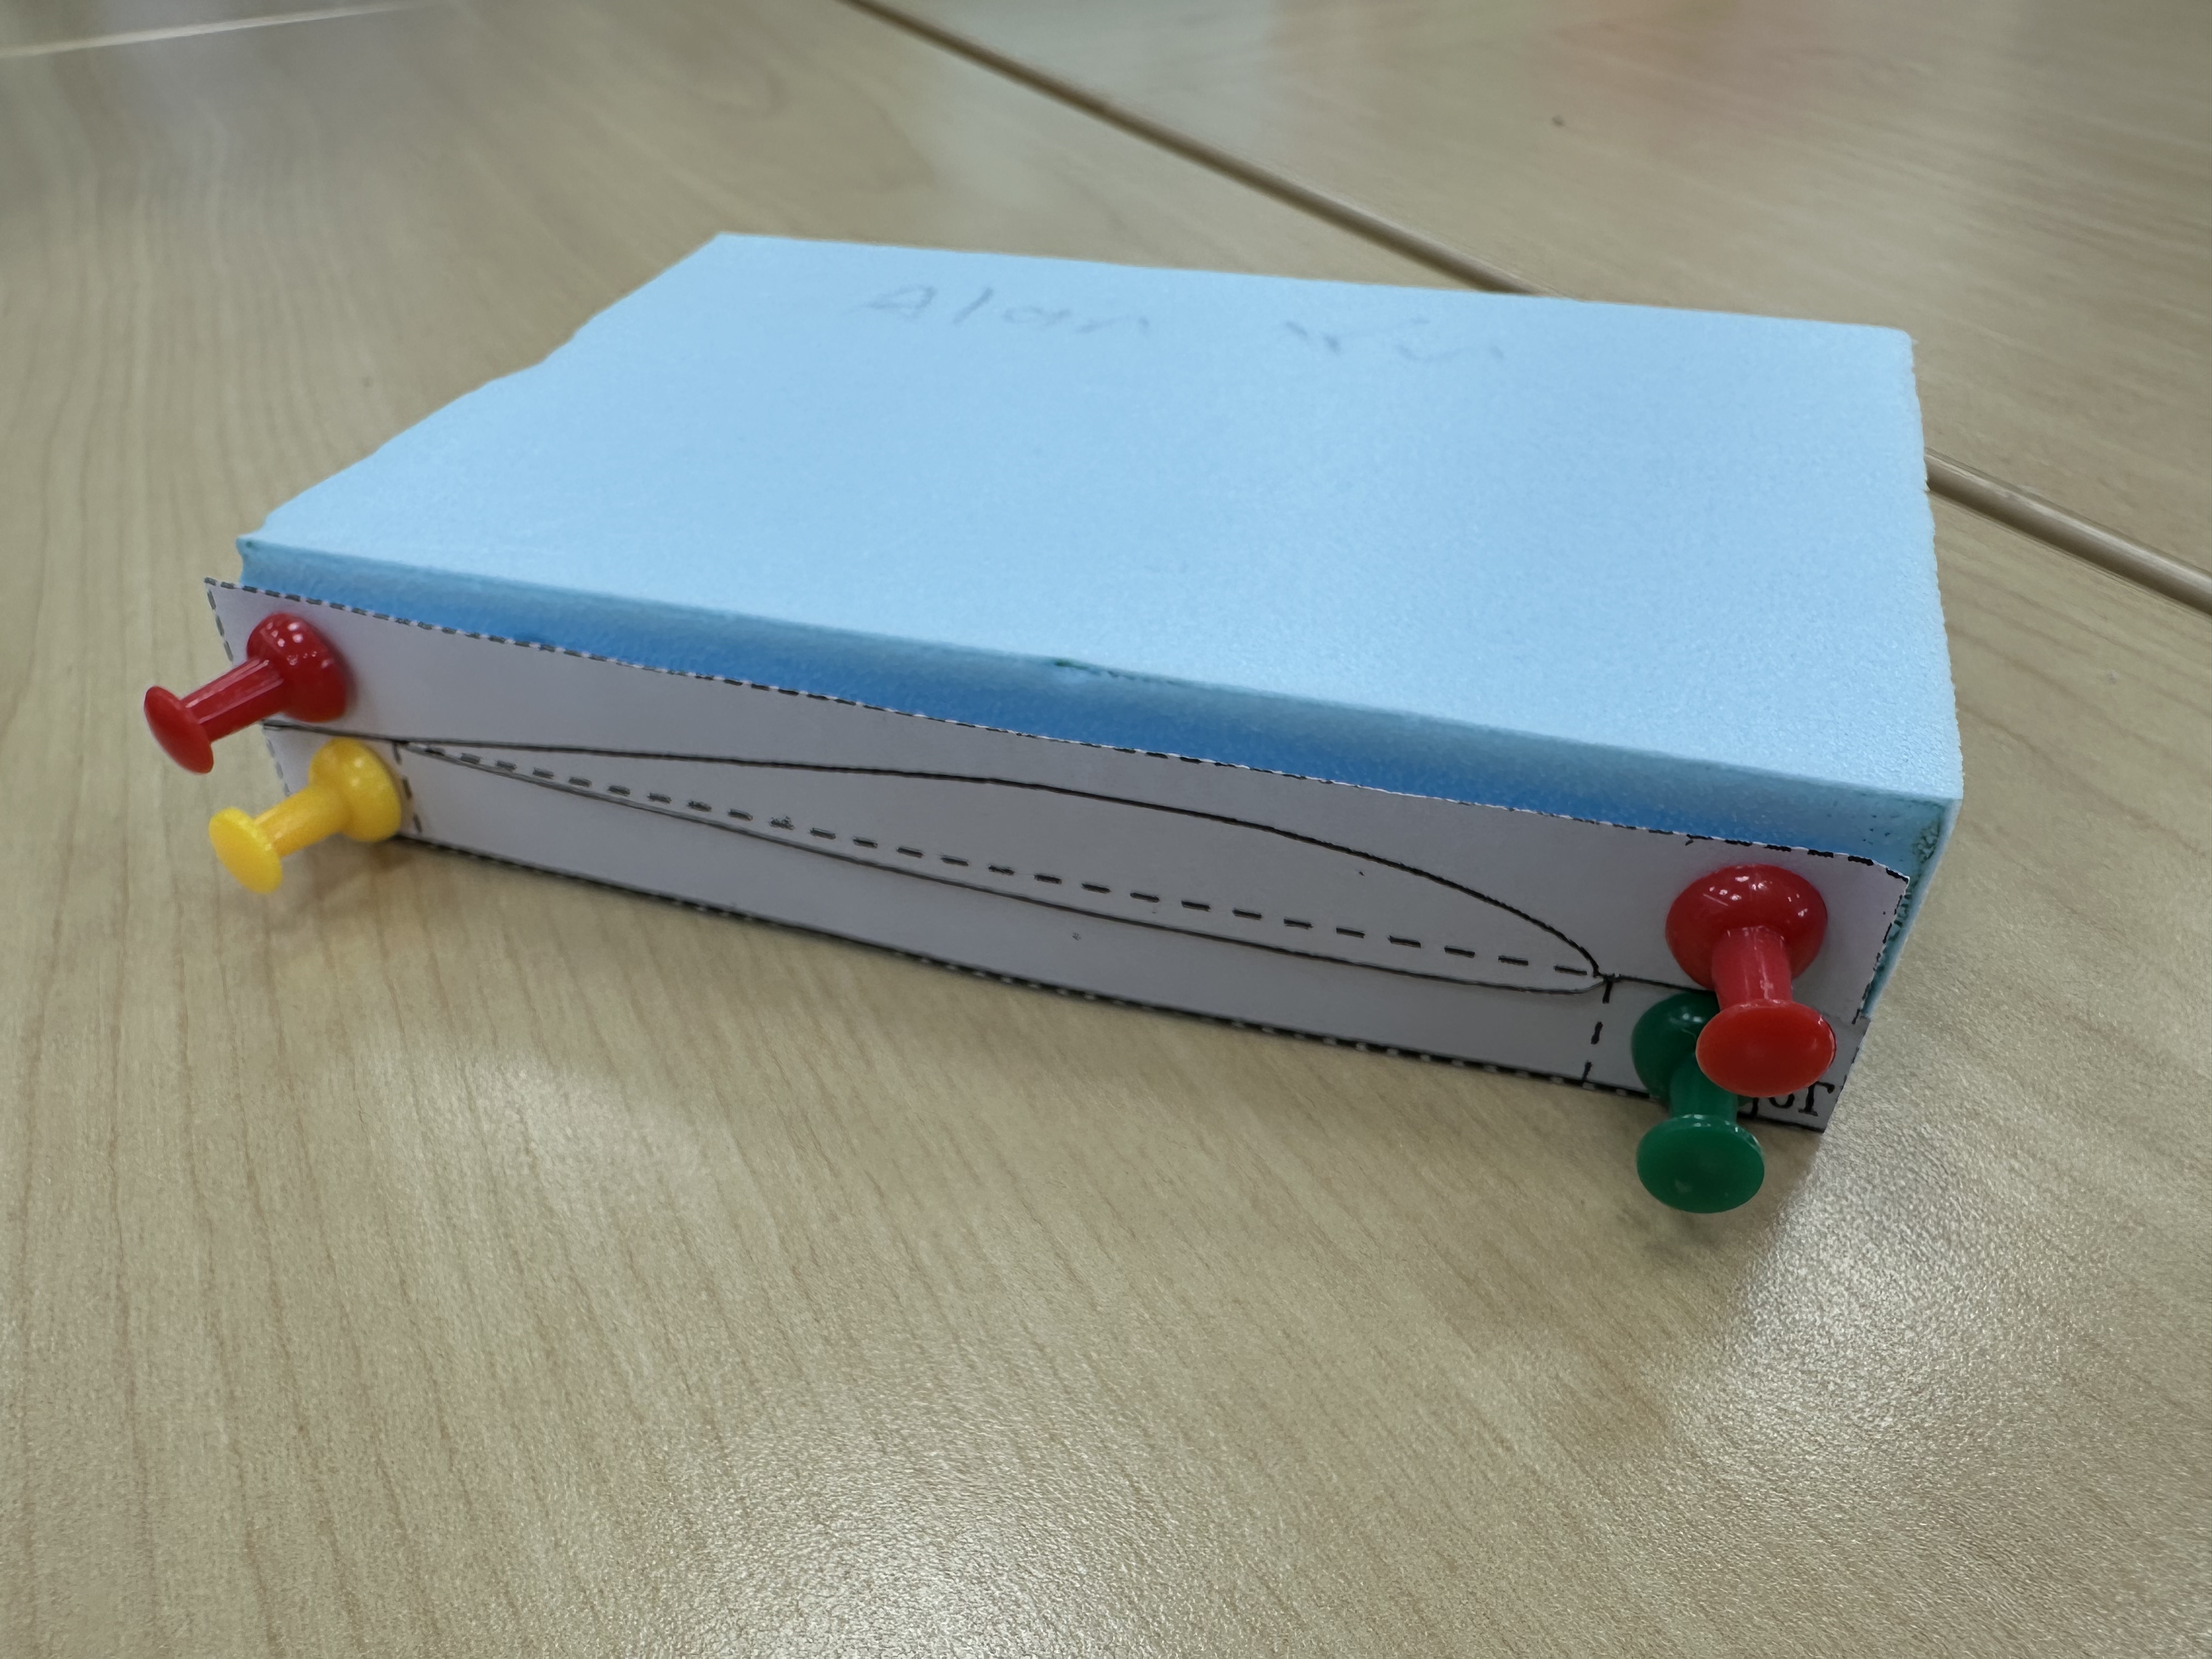 Figure 9: Paper template pinned to the foam block.
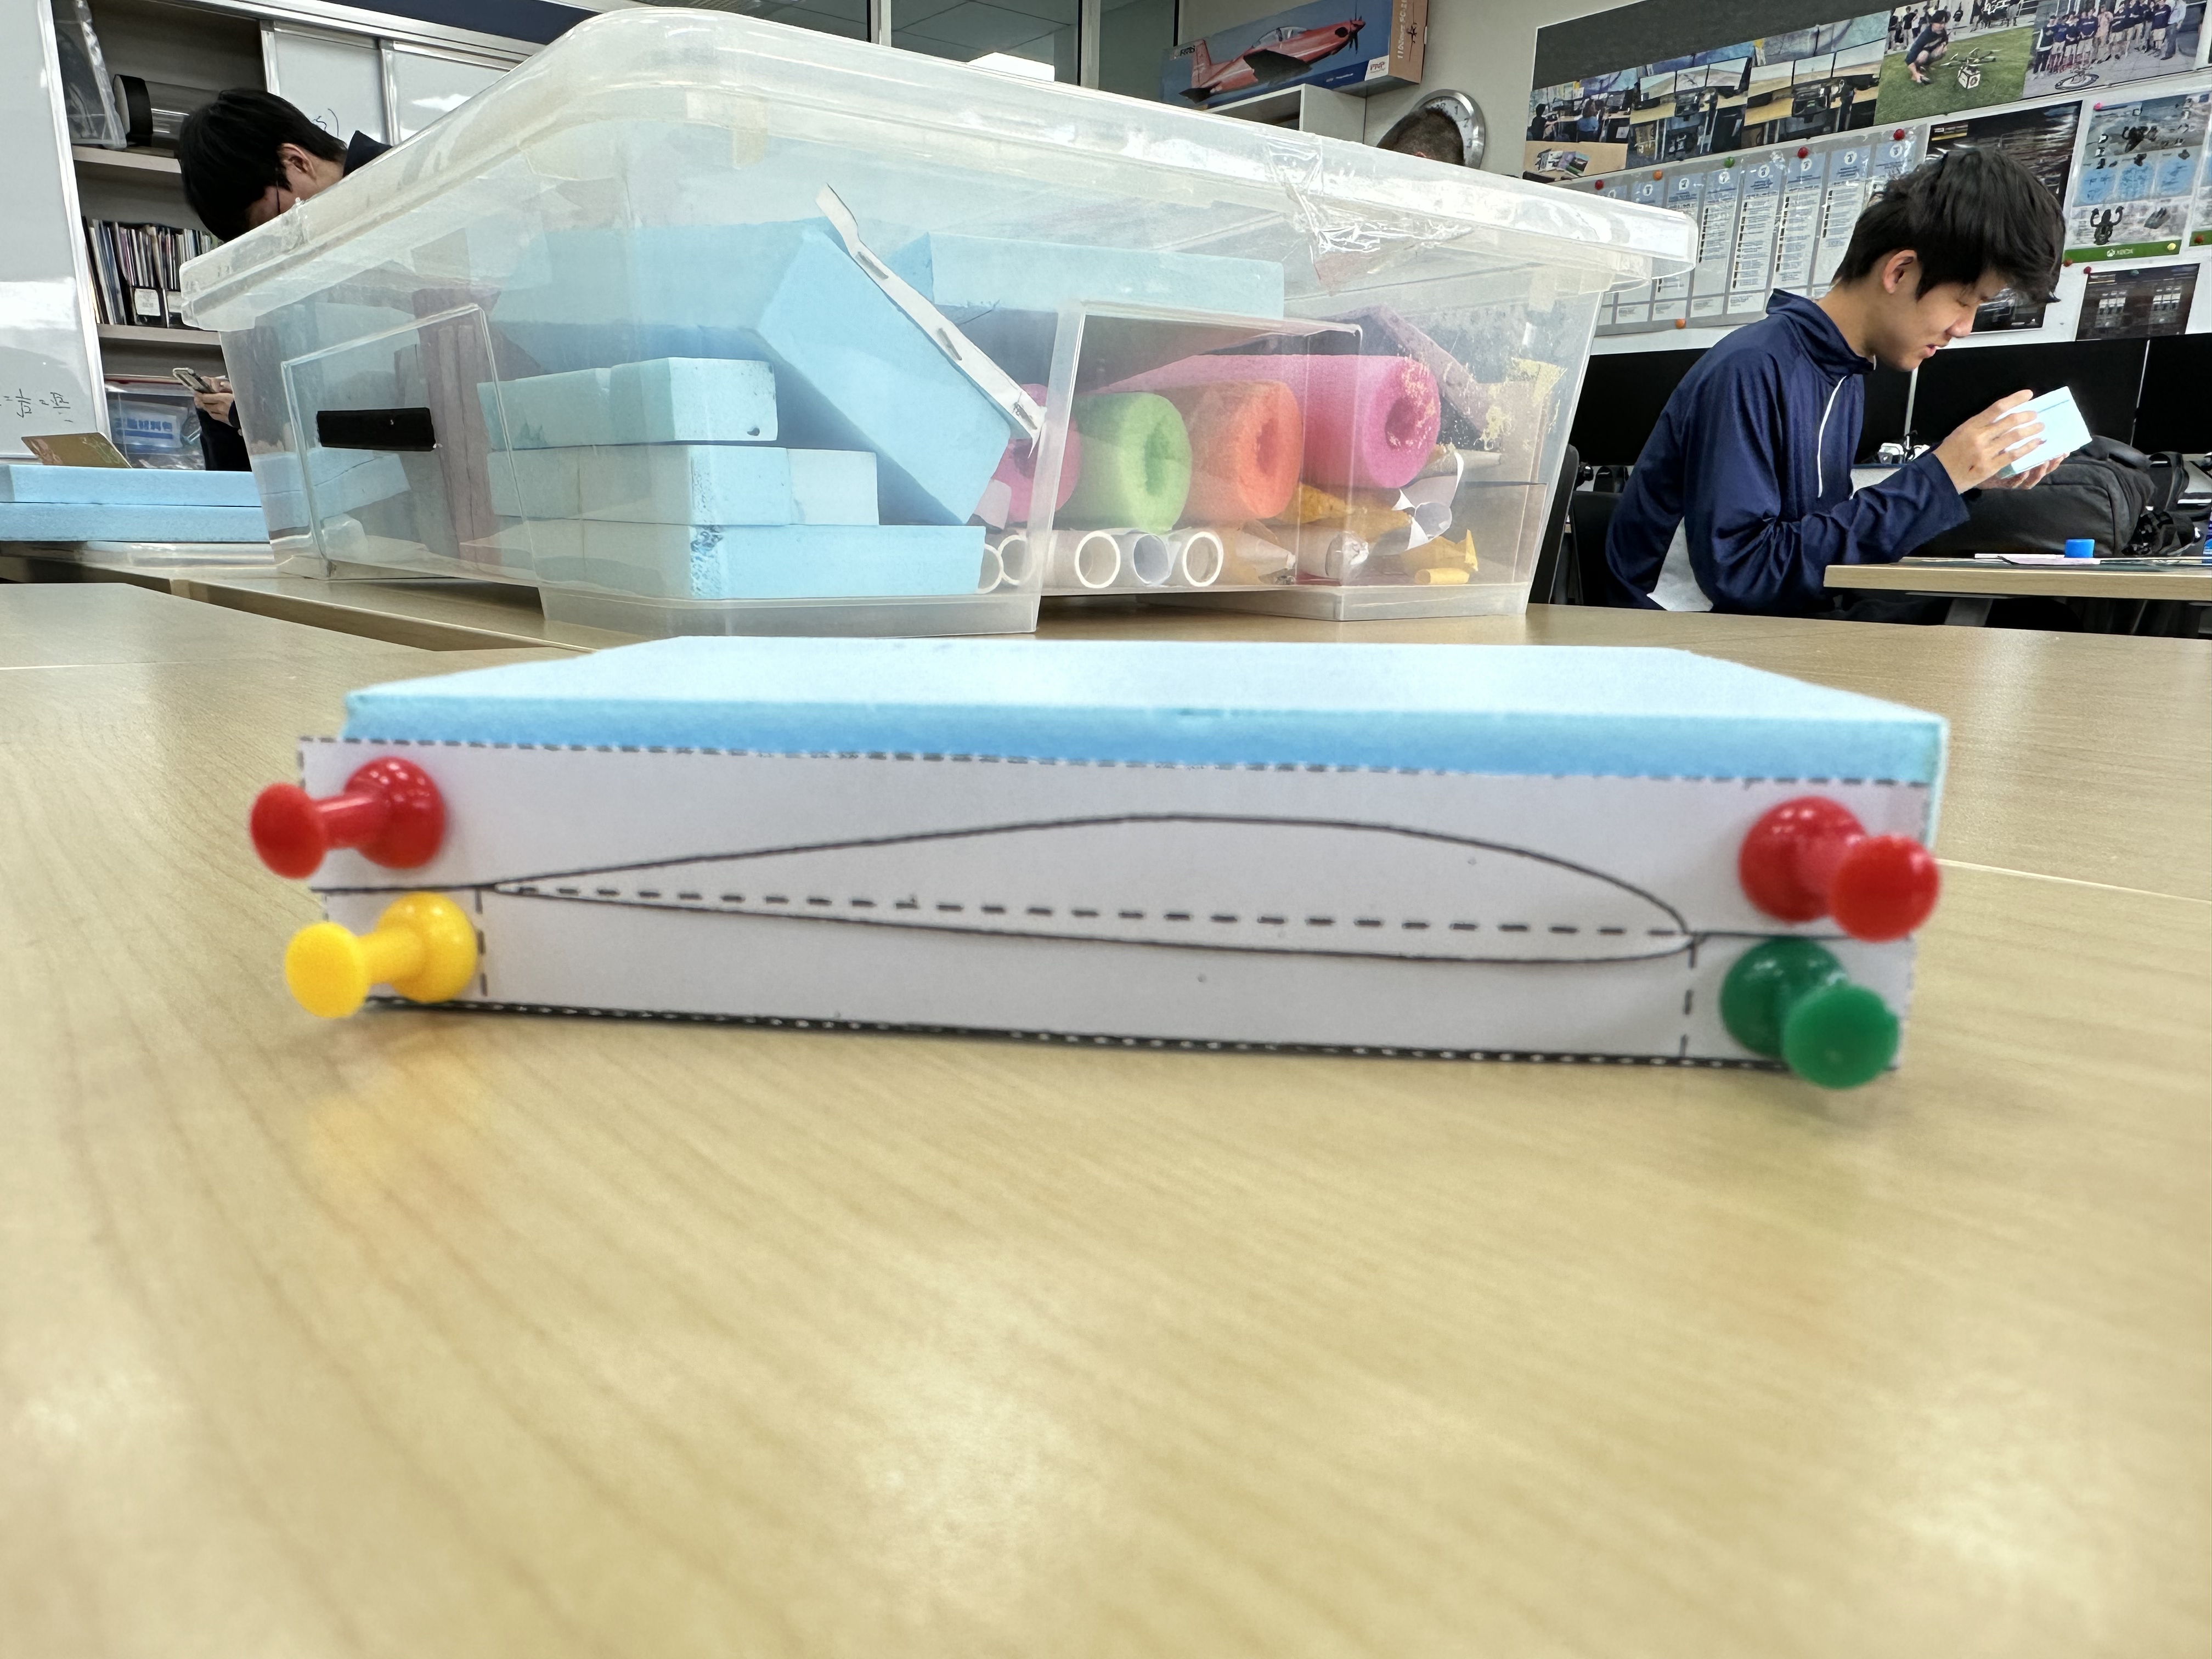
Figure 10: Side View of Paper template pinned to the foam block.
Hot-Wire Cutting
A bow-style hot-wire cutter with a wire was used to slice through the foam. The wire was heated by a power supplier until it could pass cleanly through the foam. I slowly drew the wire along the template profile on both sides of the block simultaneously, keeping the wire taut and at constant speed to minimize mistakes.
Figure 11 shows the upper face of the cut airfoils. There was still a little irregular texture, but the overview was good enough.
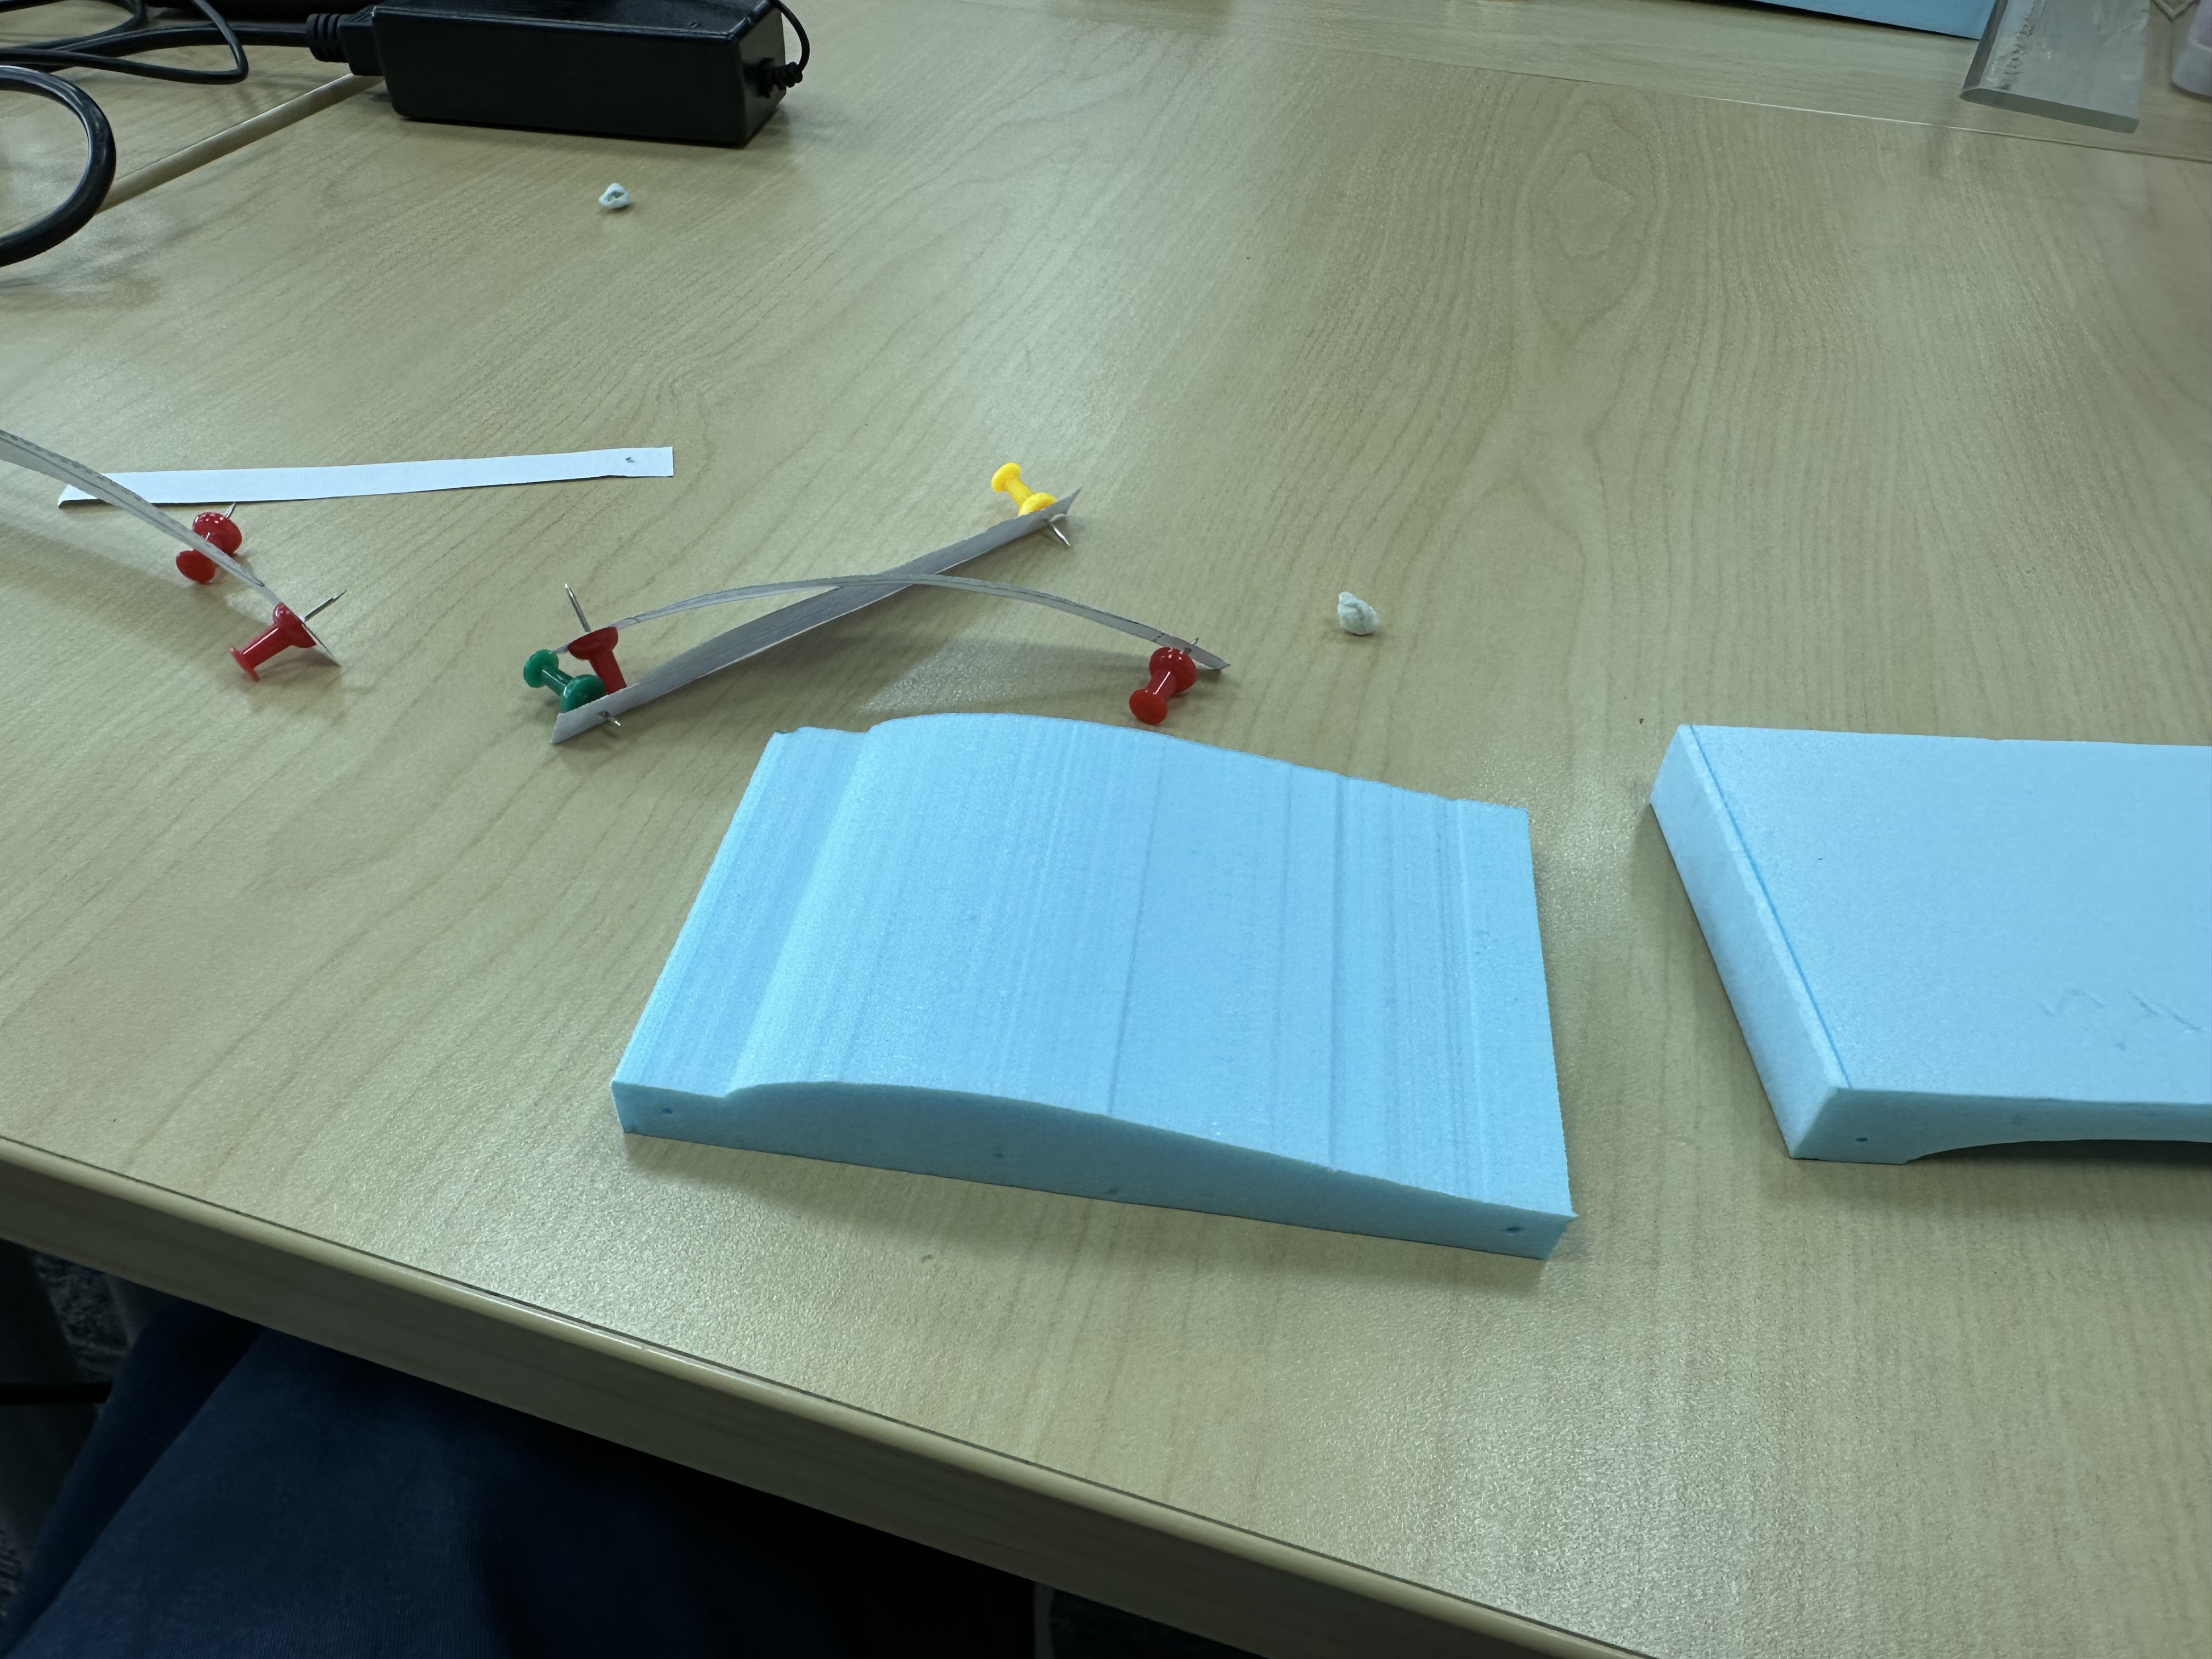 Figure 11: Top-down View of the Top Cut.
Simply do the same thing with the bottom face. Figure 12 shows the bottom face of the cut airfoils.
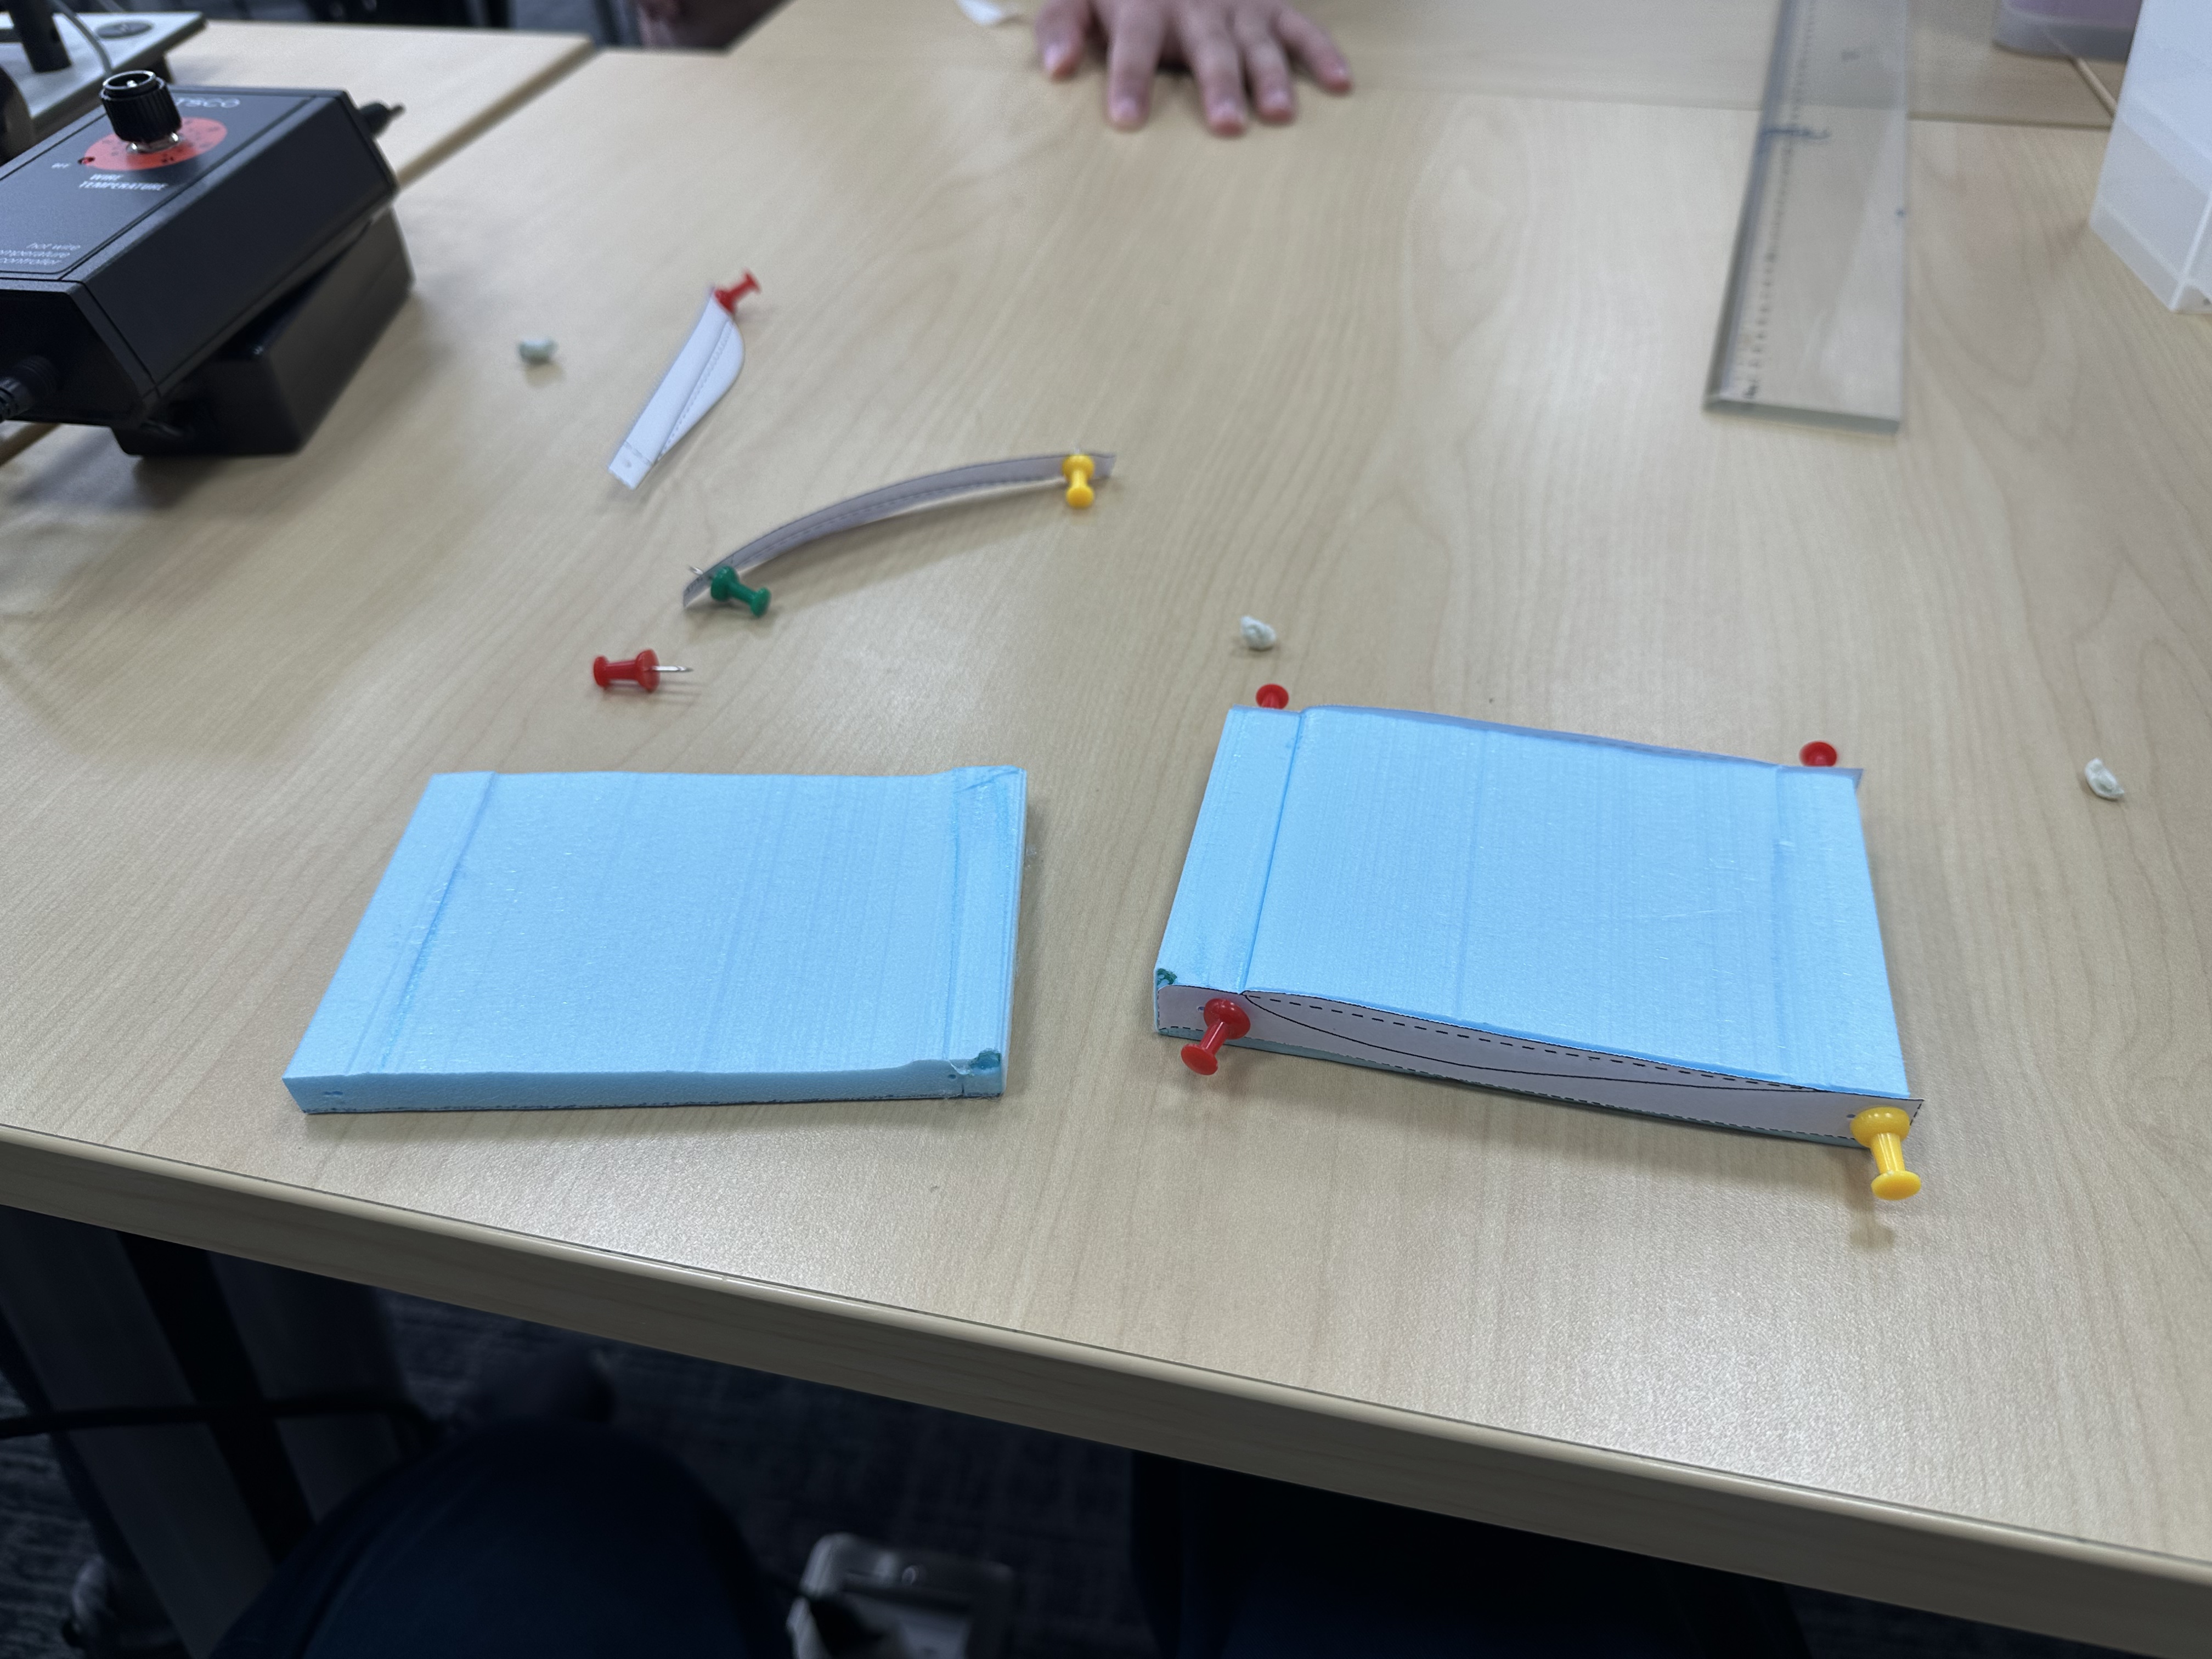 Figure 12: Top-down View of the Bottom Cut.
Finishing Cutting
The cut faces of the foam were still rough after the hot-wire pass. To reduce surface drag and bring the shape more perfect, the airfoil was polished manually with sandpaper as surface smoothness is particularly important because surface roughness can trigger premature laminar–turbulent transition and disrupt the laminar separation bubble (Selig et al., 1995). Figure 13–15 shows different dimensions of the finished airfoil.
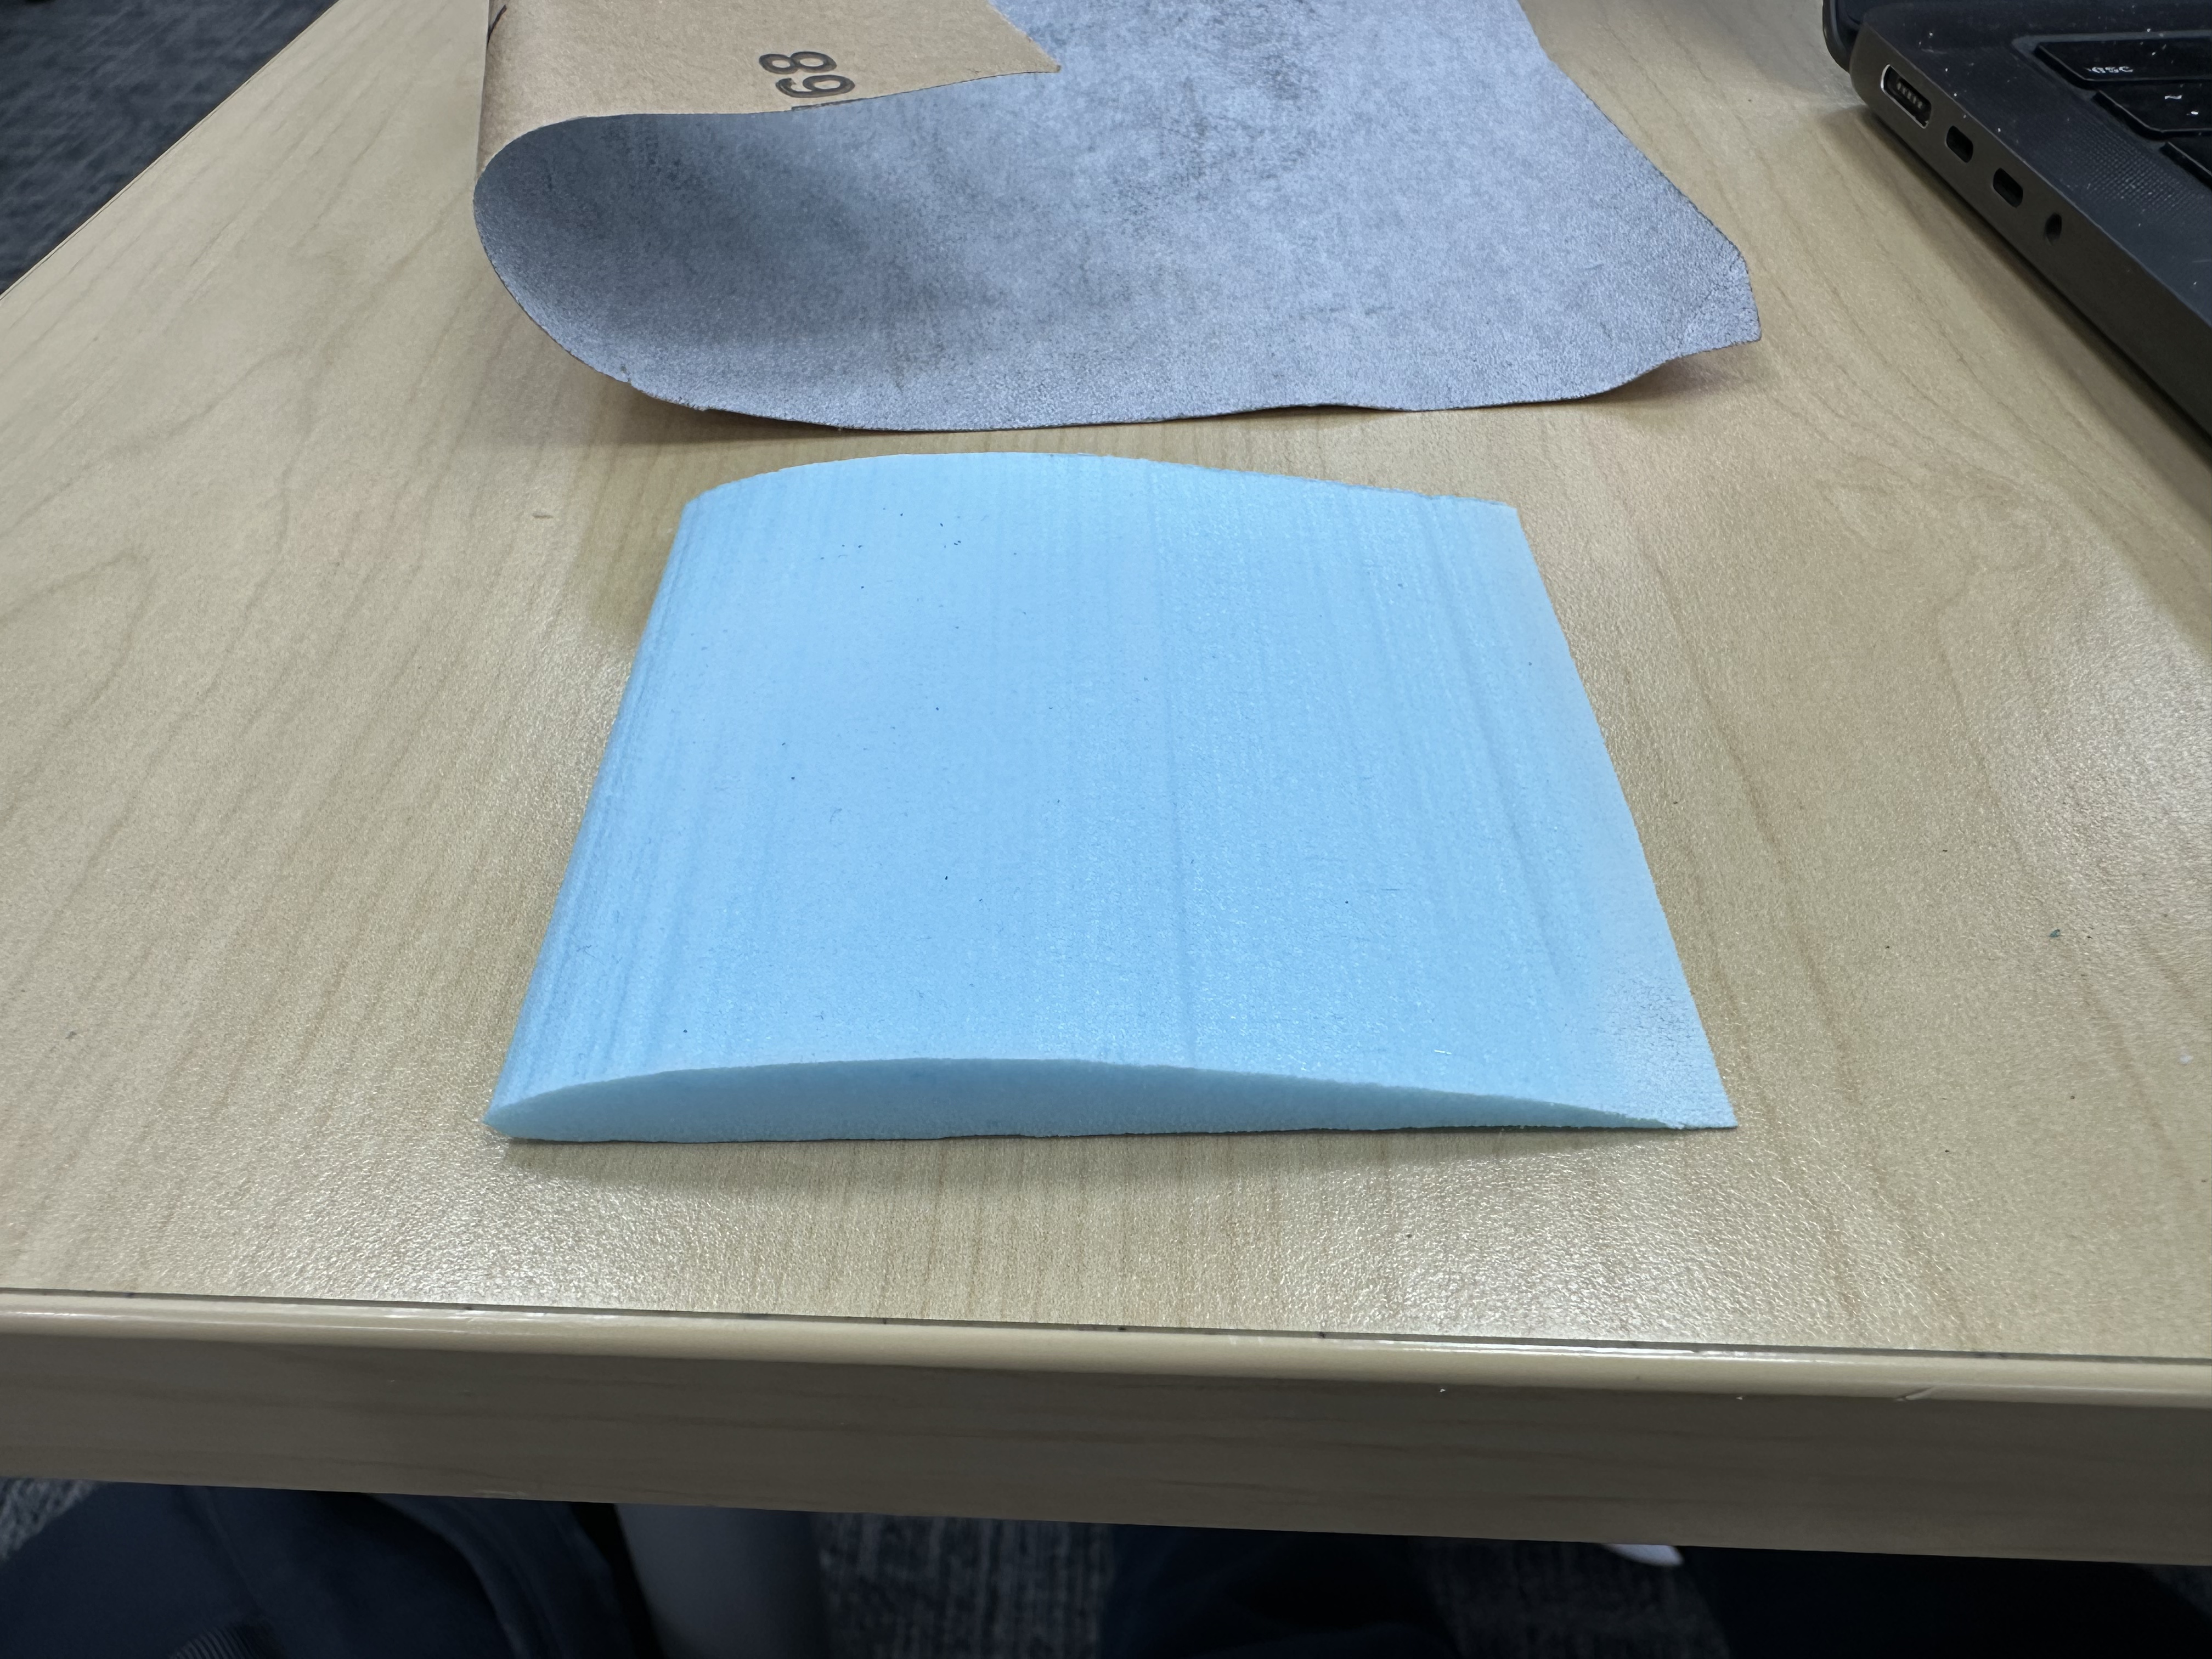 Figure 13: The Airfoil after Polishing.
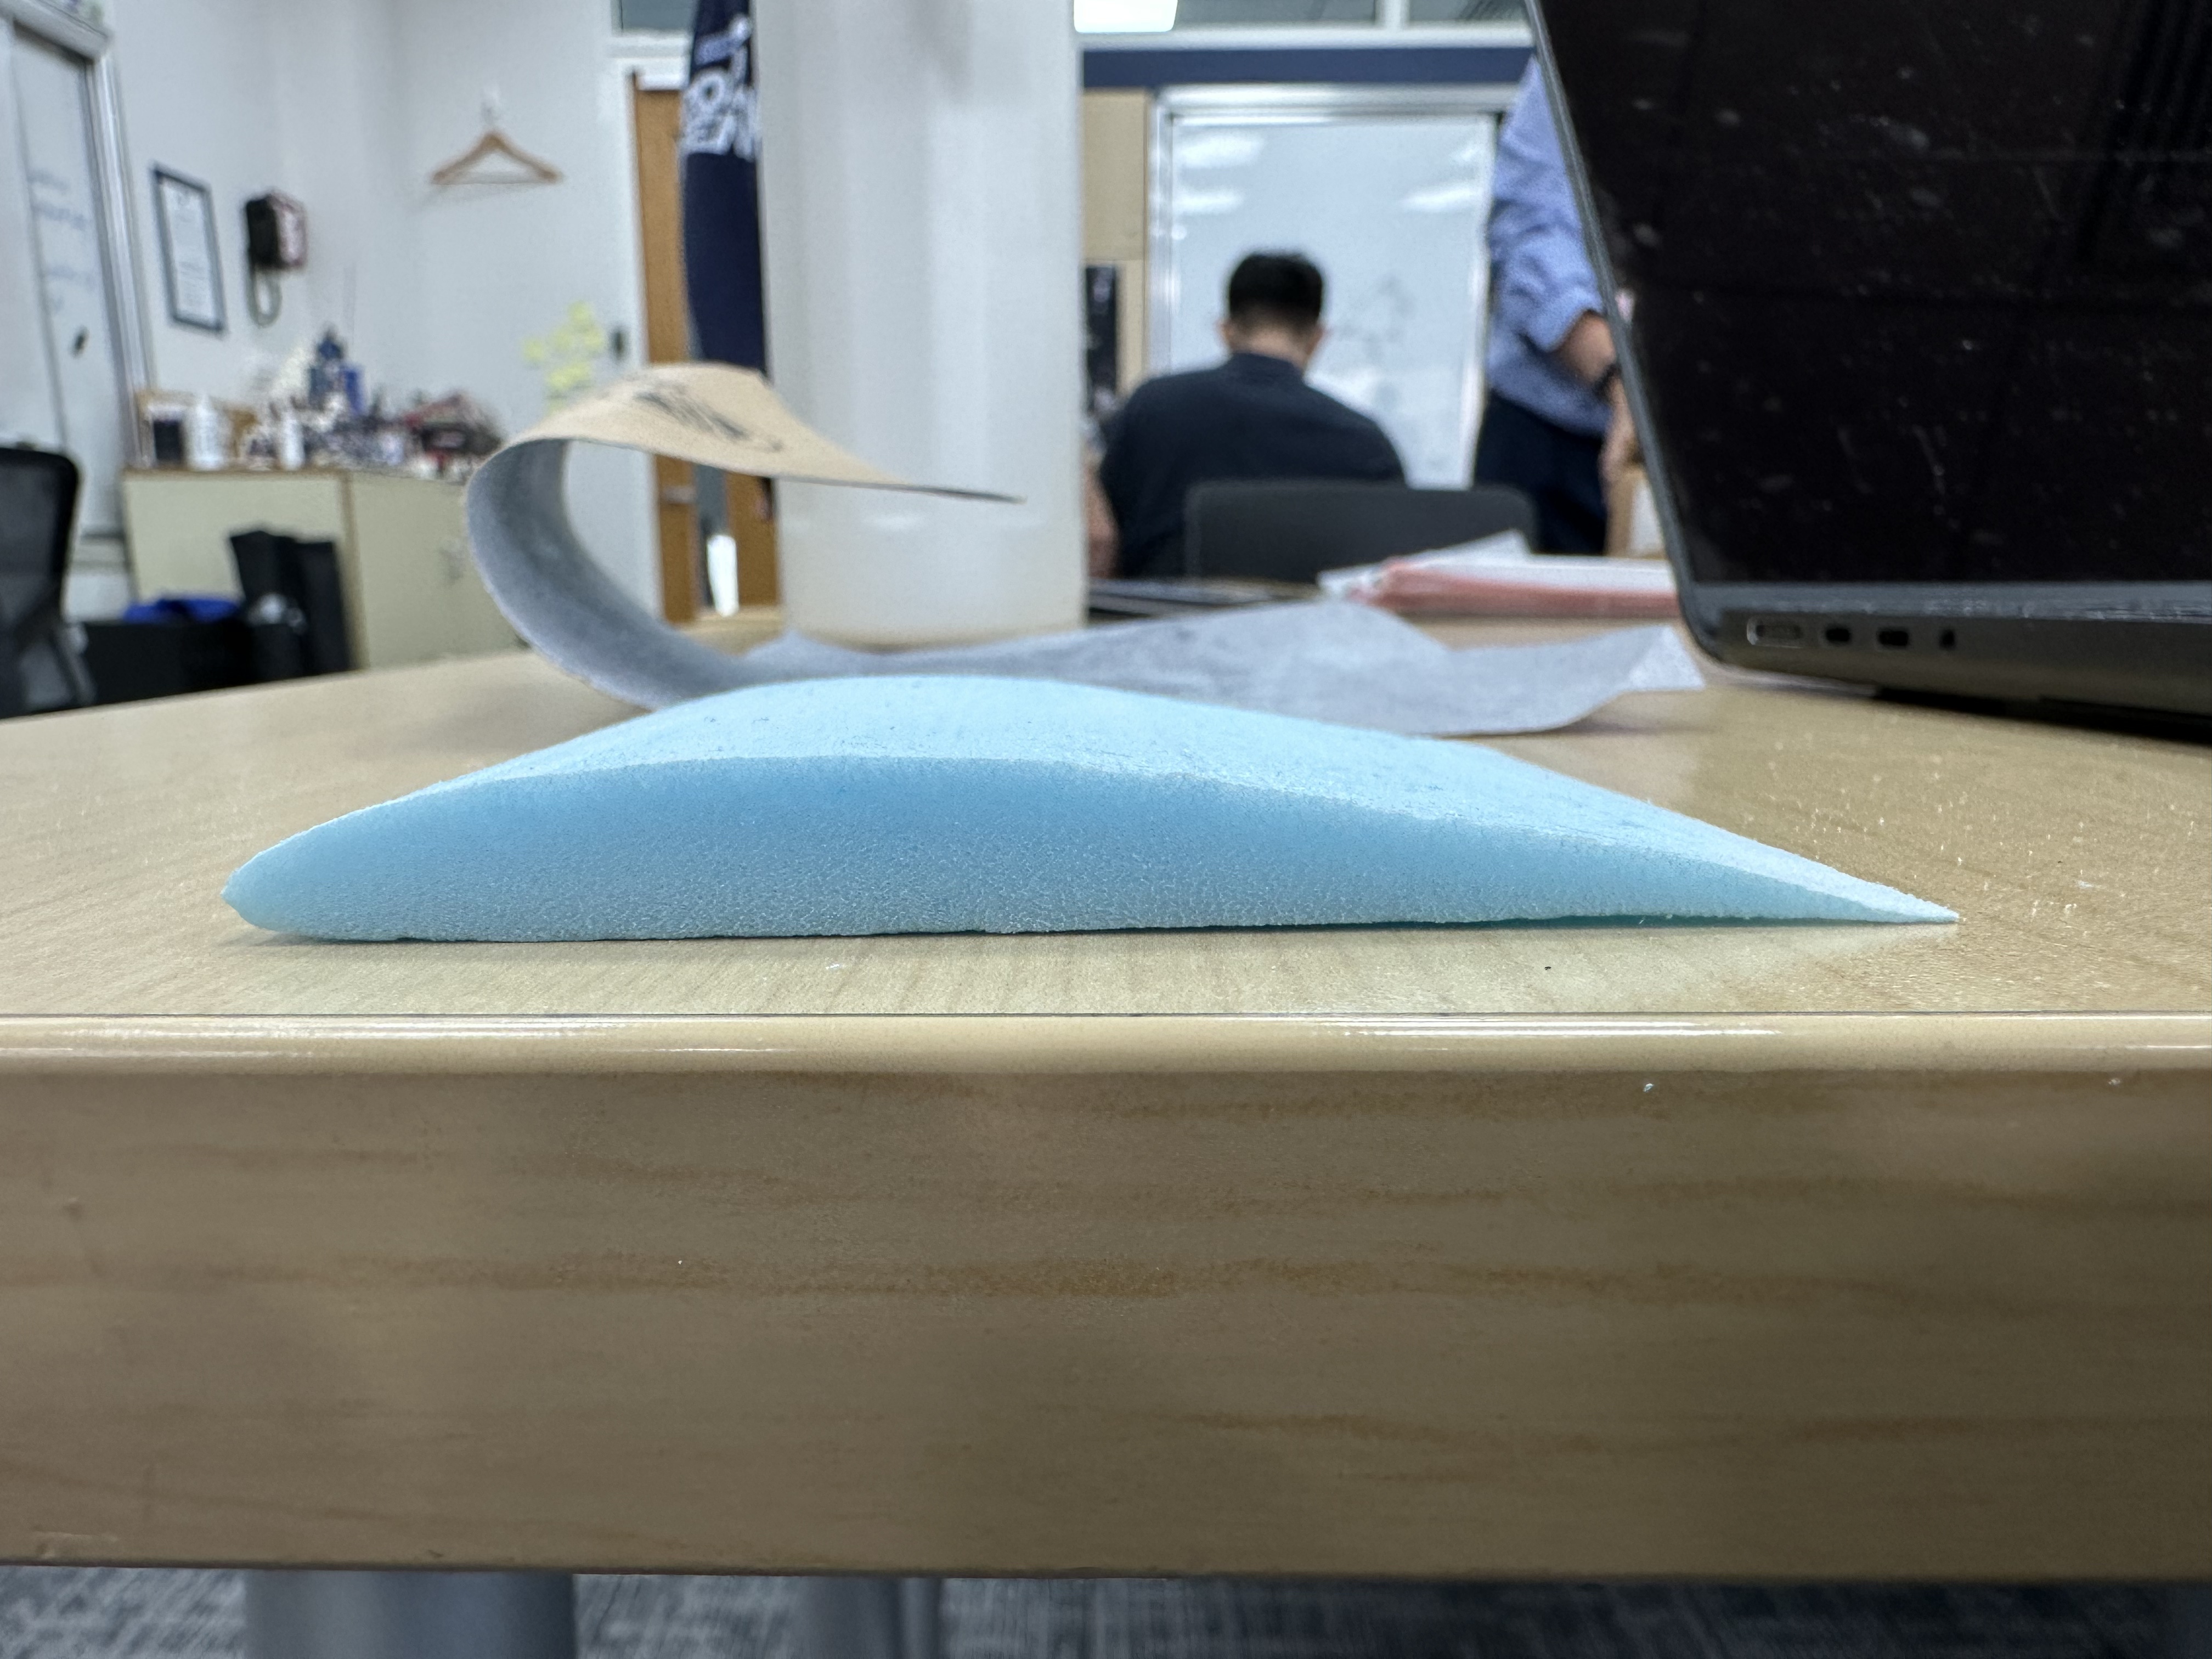
Figure 14: Side View of the Airfoil.
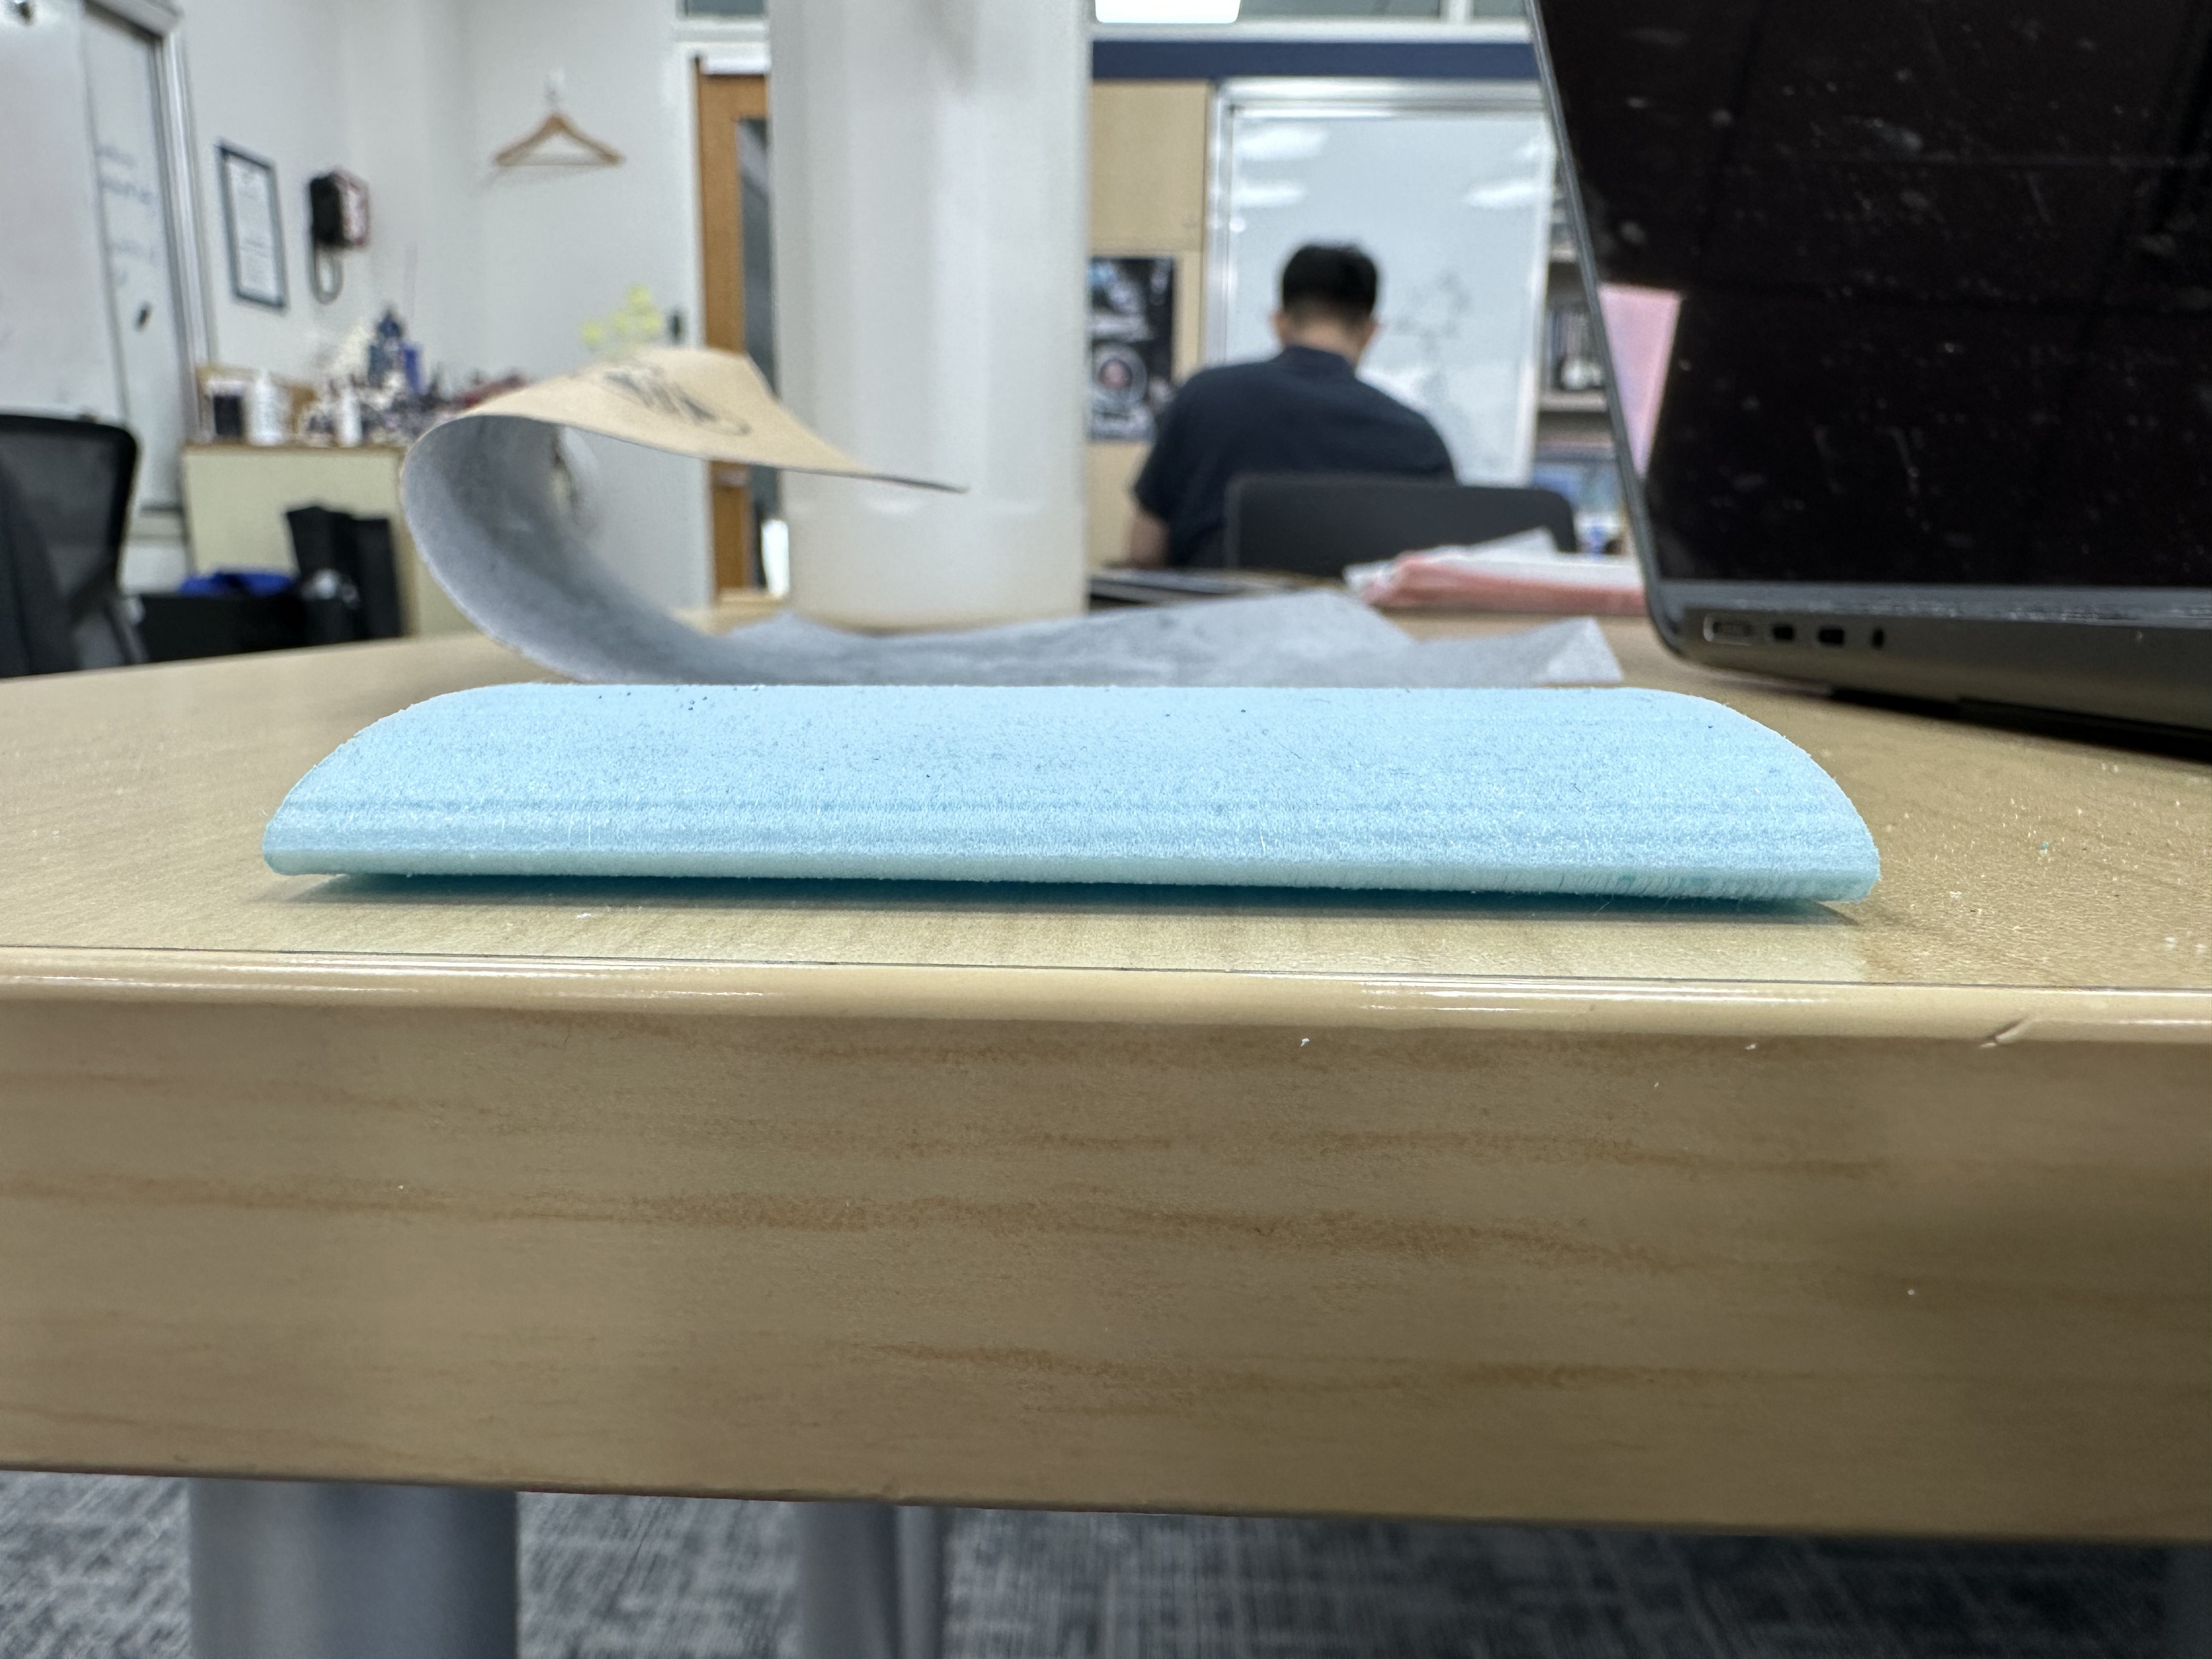
Figure 15: Front View of the Airfoil.
Wind Tunnel Testing
A small low-speed wind tunnel machine was used to evaluate the airfoils. A digital anemometer was used to record the wind speed. A ruler was used to measure the height.
Setup
The airfoil was bundled on a dynamic horizontal rod, with the chord line set parallel to the tunnel floor at zero AOA (parallel to the floor) as the initial test condition. As shown in Figure 16, the initial setup contains a dynamic rod with the airfoil bundled on it. The ruler was for measuring the height, and the anemometer was for measuring the wind speed. Figure 17 shows the initial height of the airfoil with a wind speed of 0 m/s. The height is approximately 10cm above the ground.
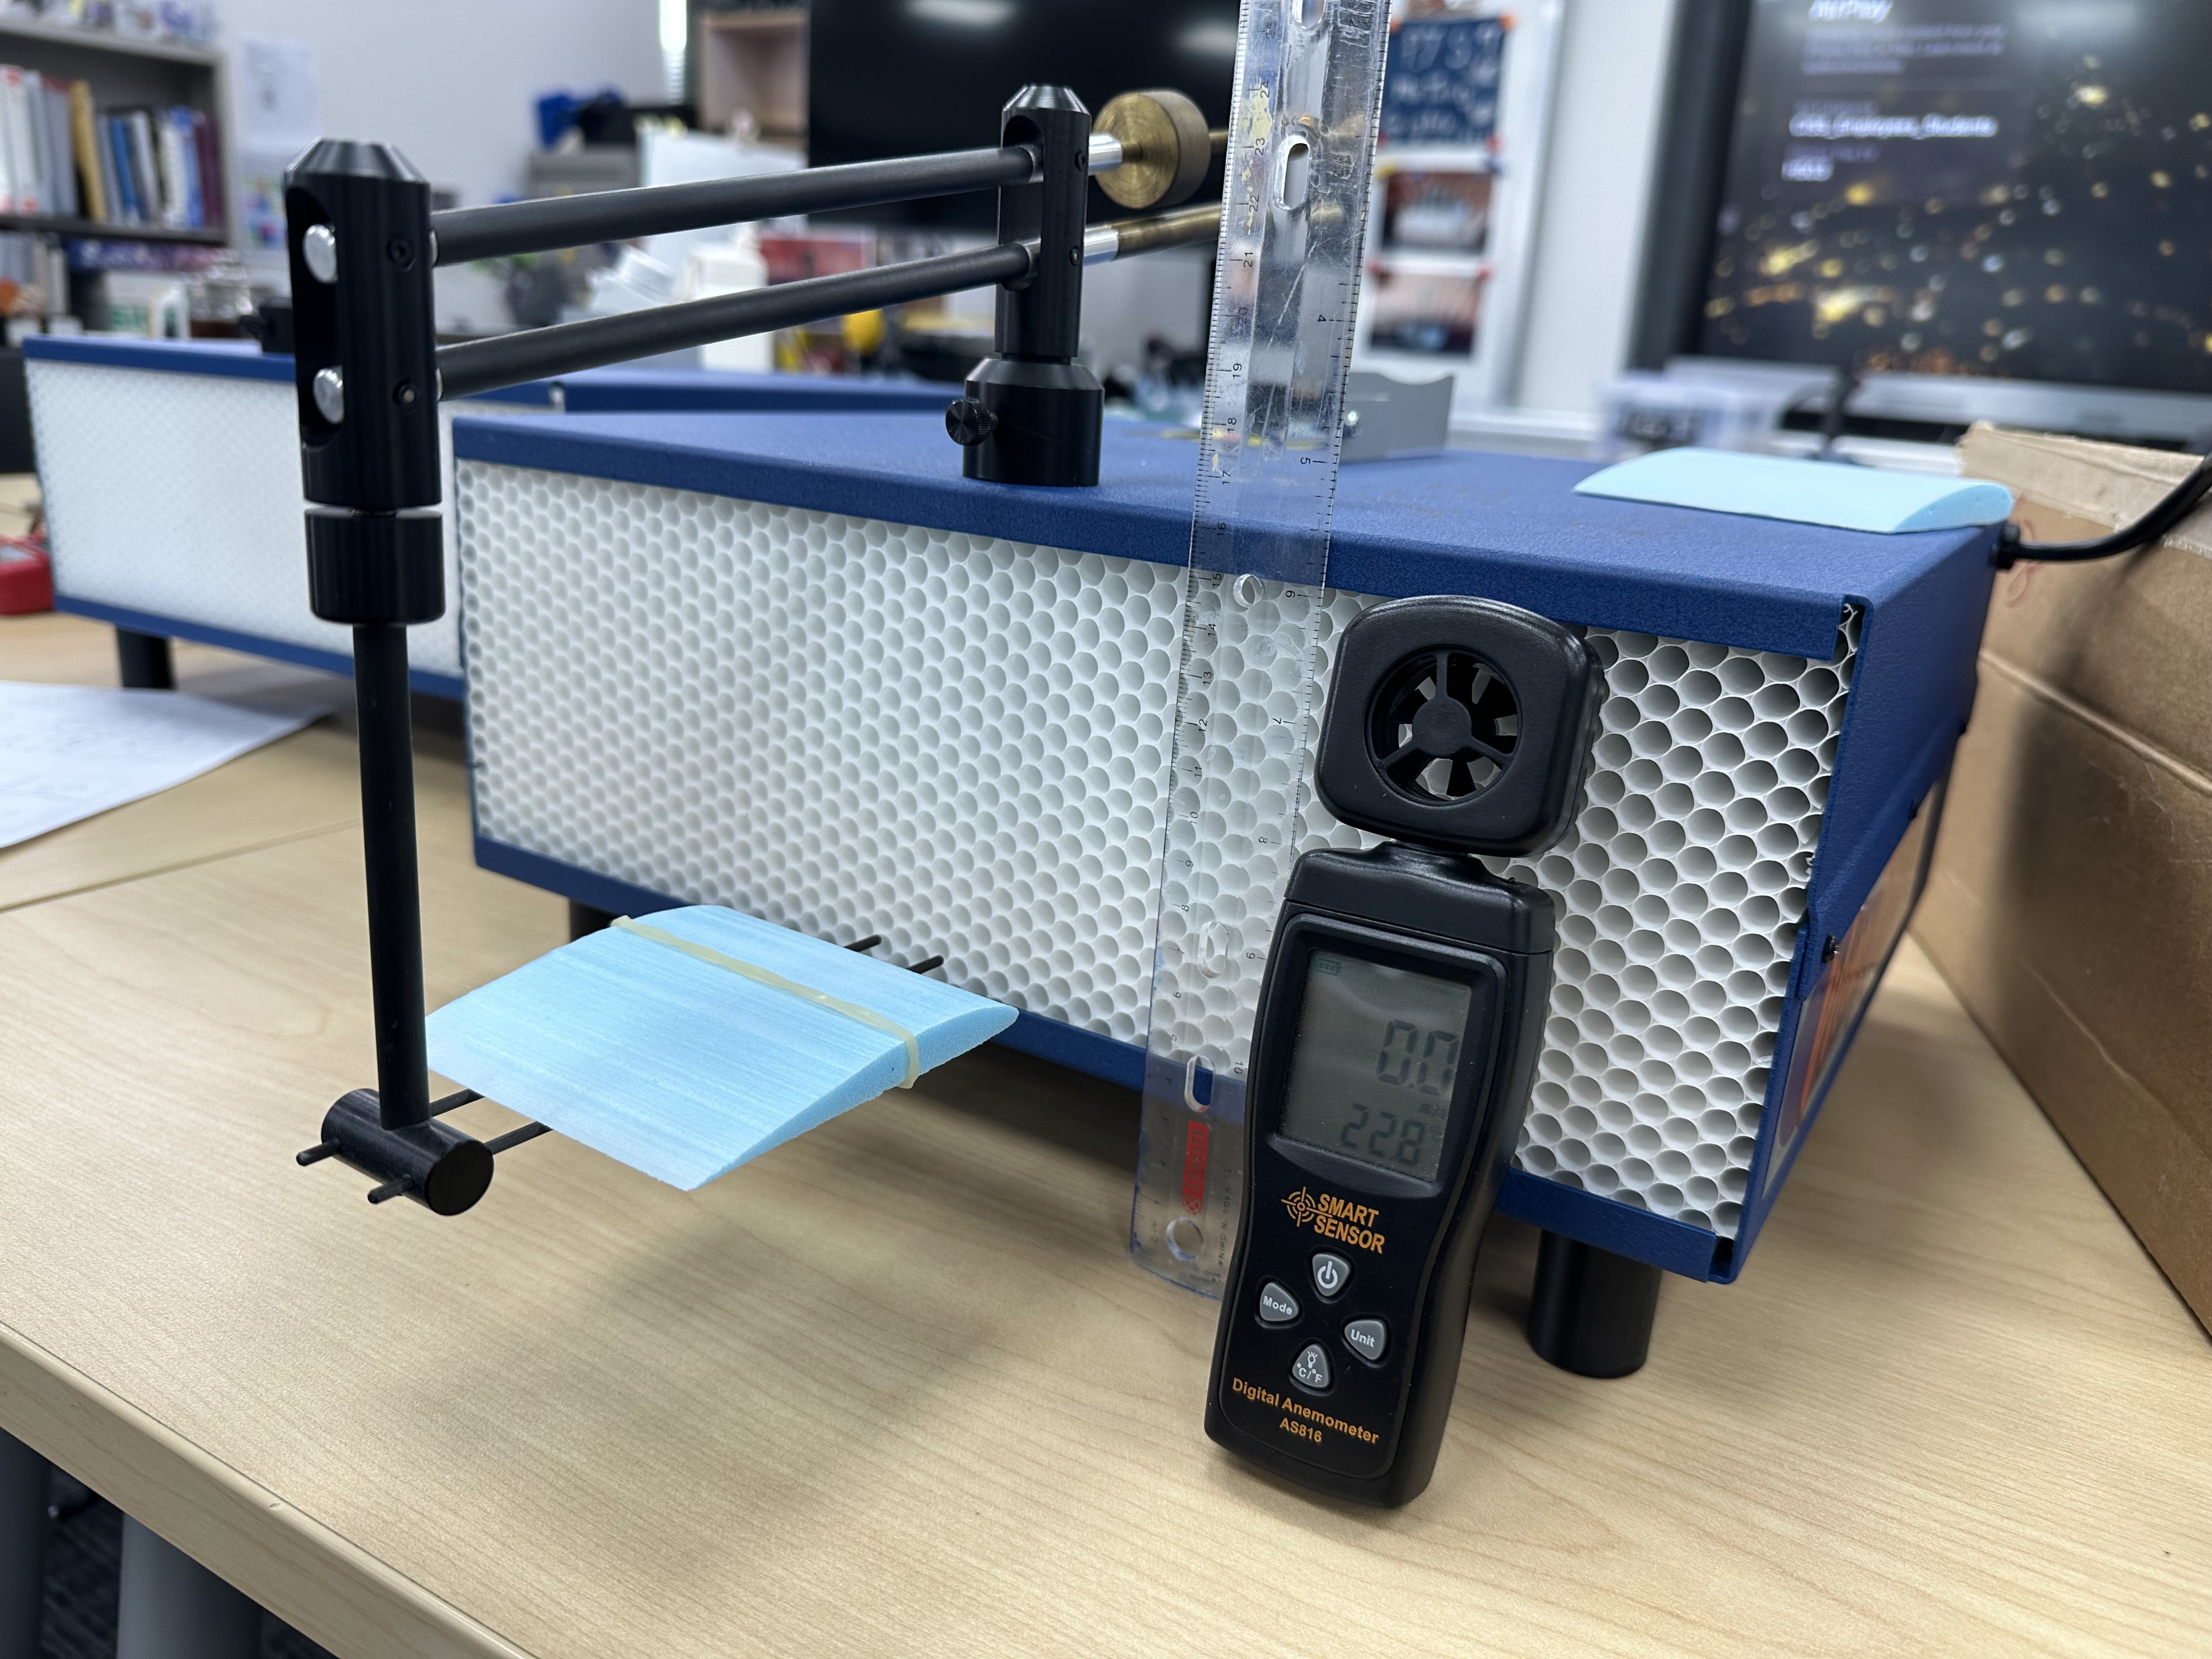
Figure 16: Overview of the Initial Setup.
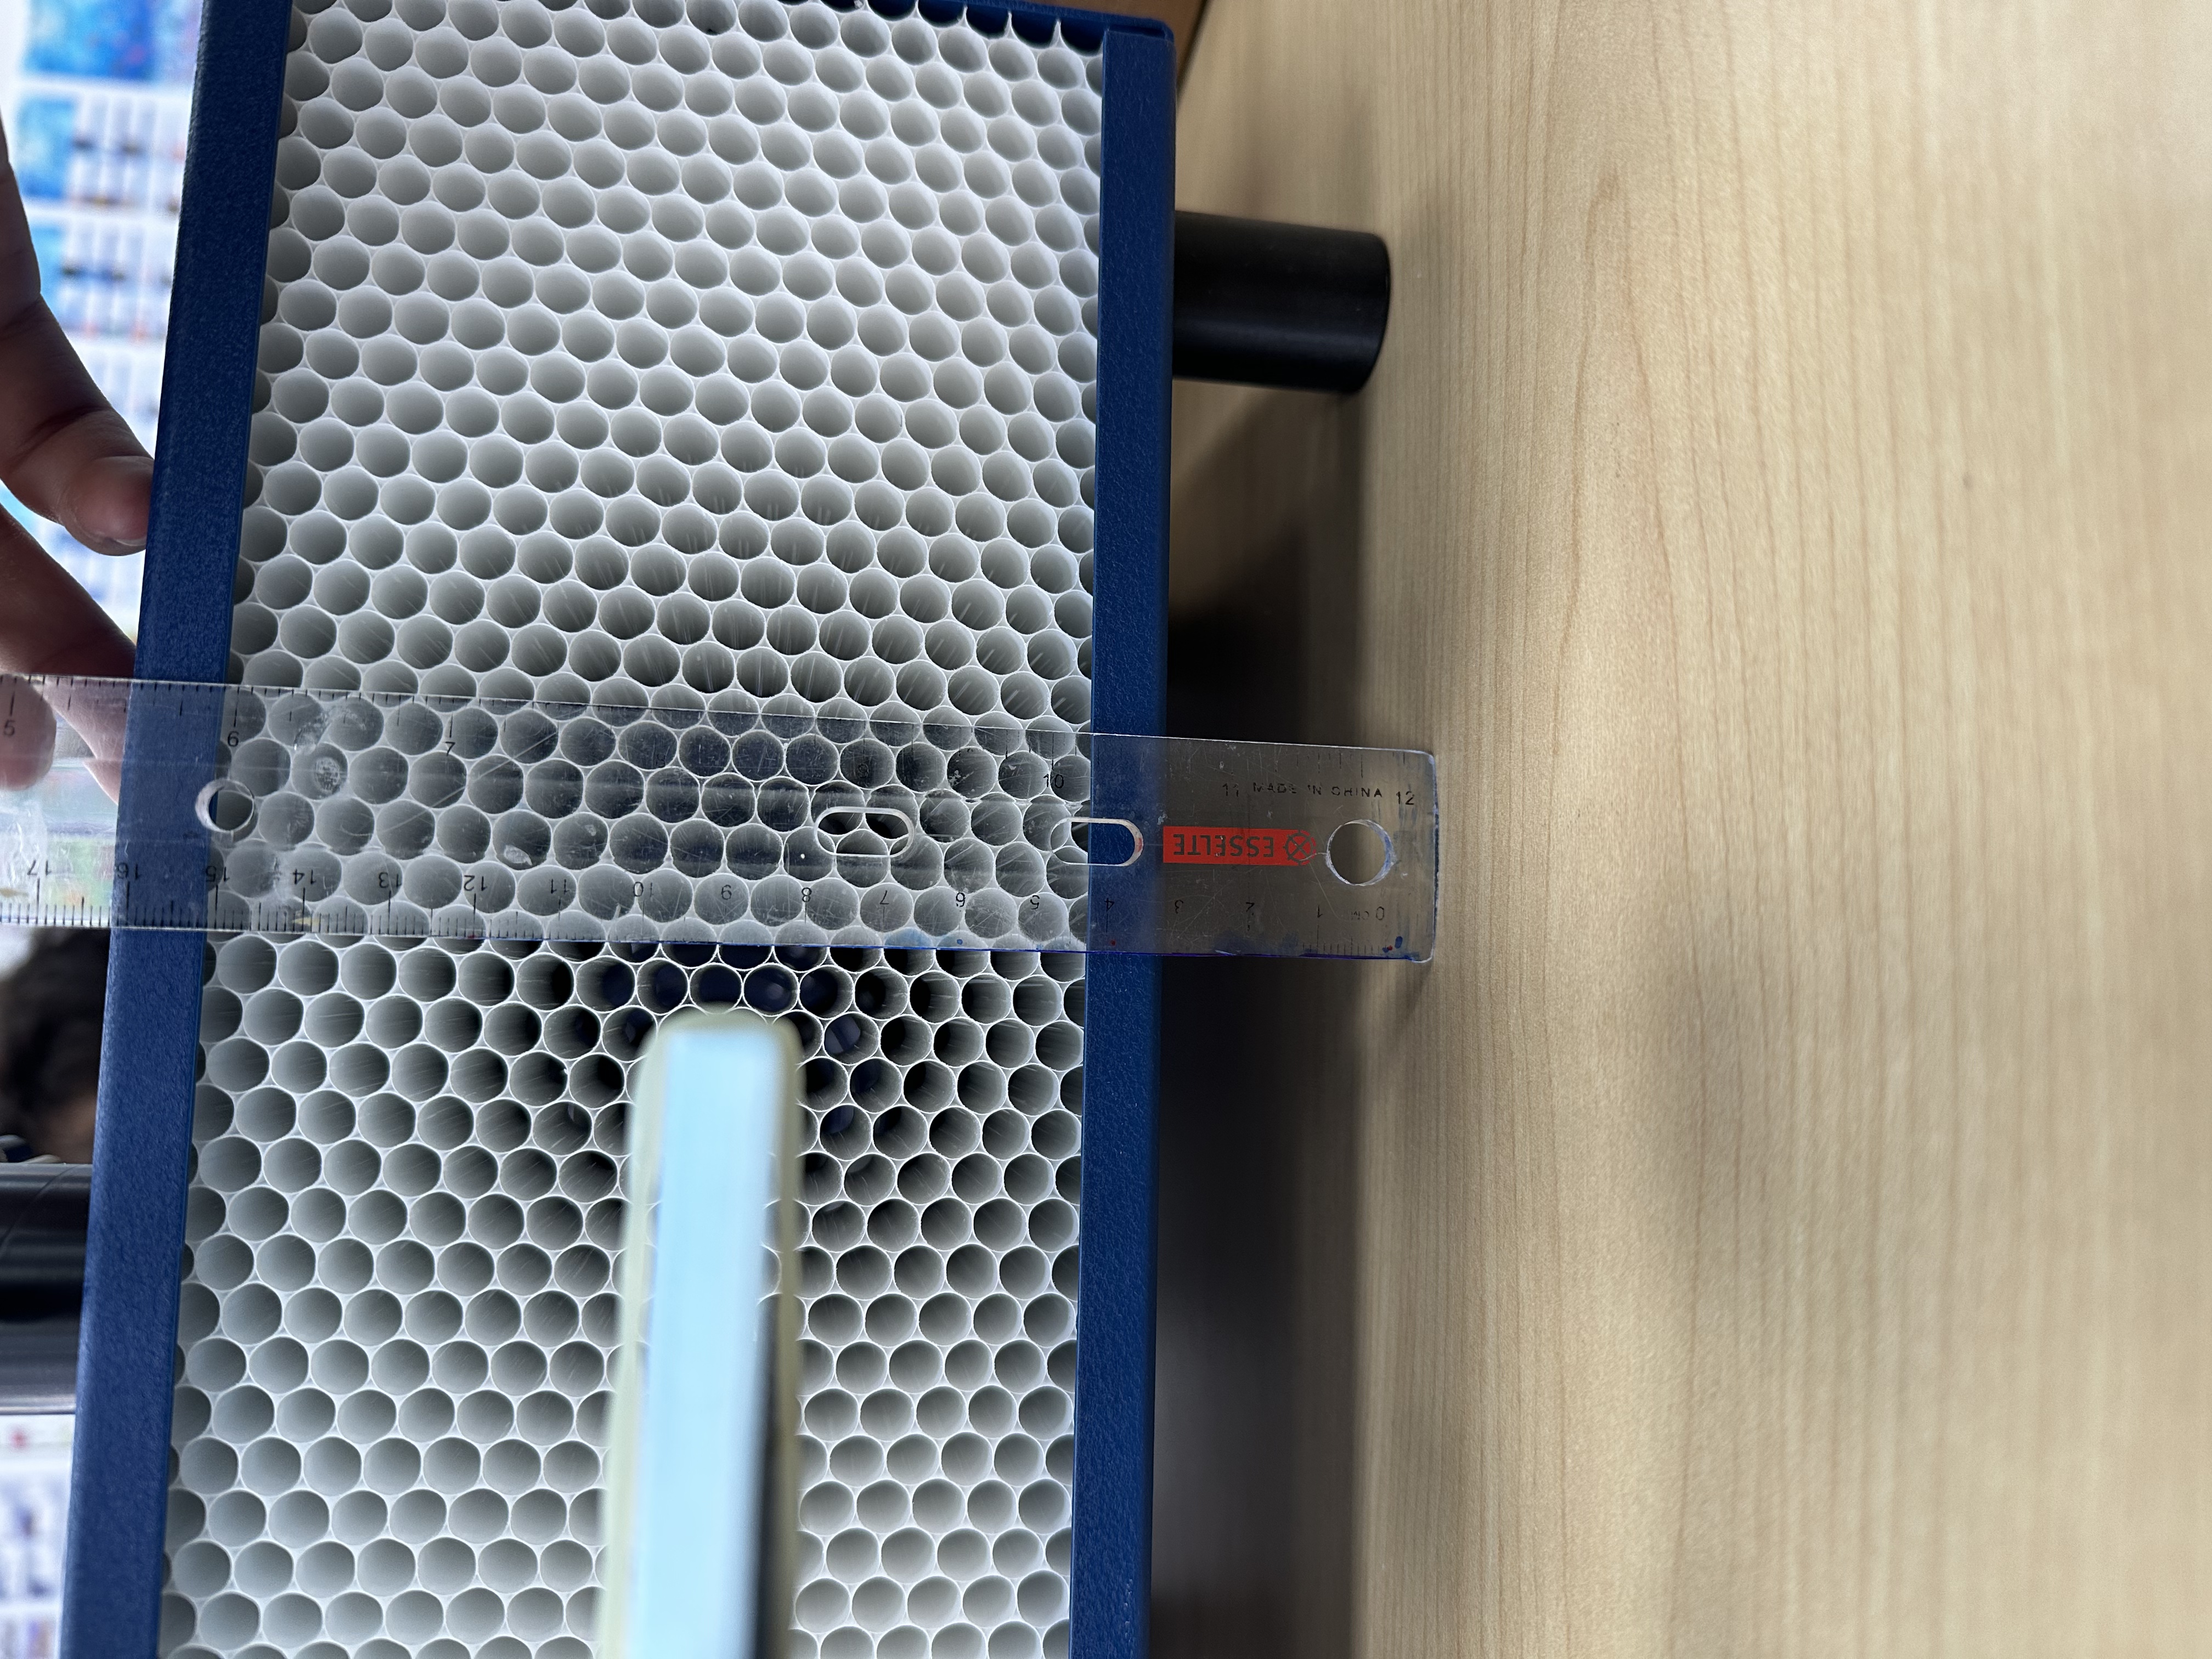
Figure 17: Measurement of the Initial Height.
As shown in Figure 18, the anemometer was placed outside the tunnel to measure the velocity experienced by the airfoil. After the machine was turned on, the reading showed that the wind speed was approximately 1.9 m/s.
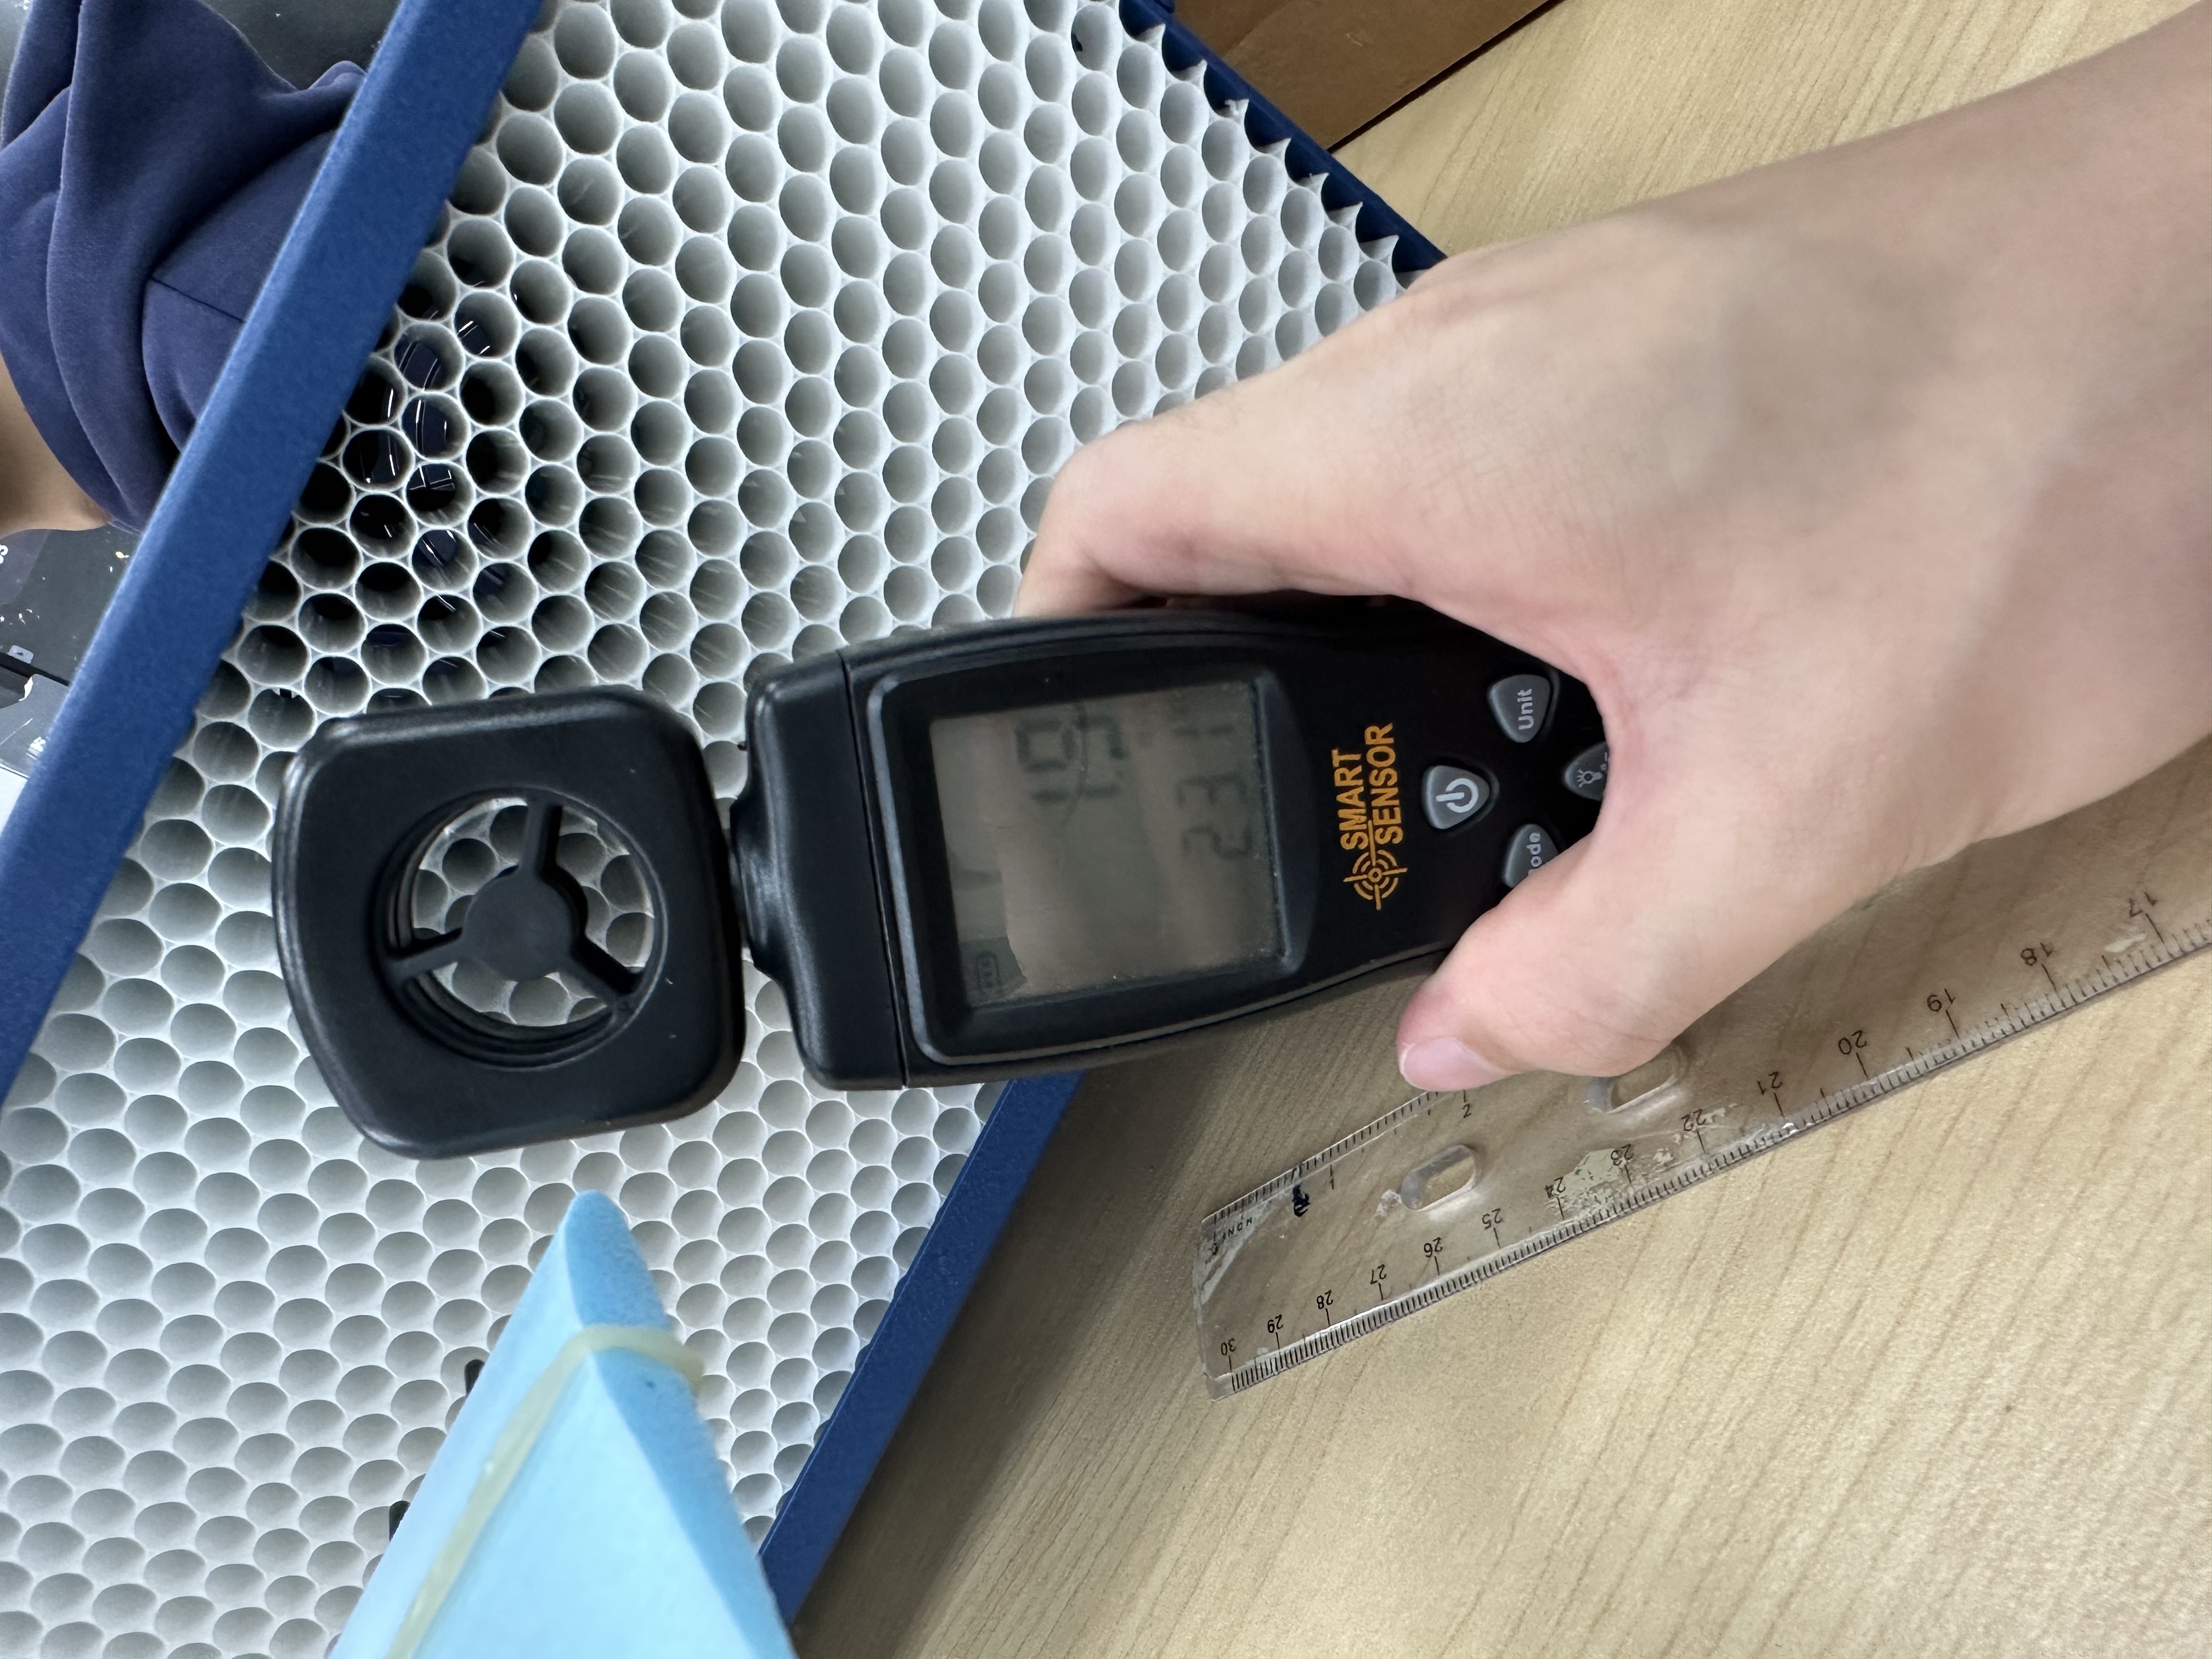 Figure 18: Wind Speed Measurement.
As shown in Figure 19, after the machine was turned on, the reading of the height above the ground rose to about 11.5cm.
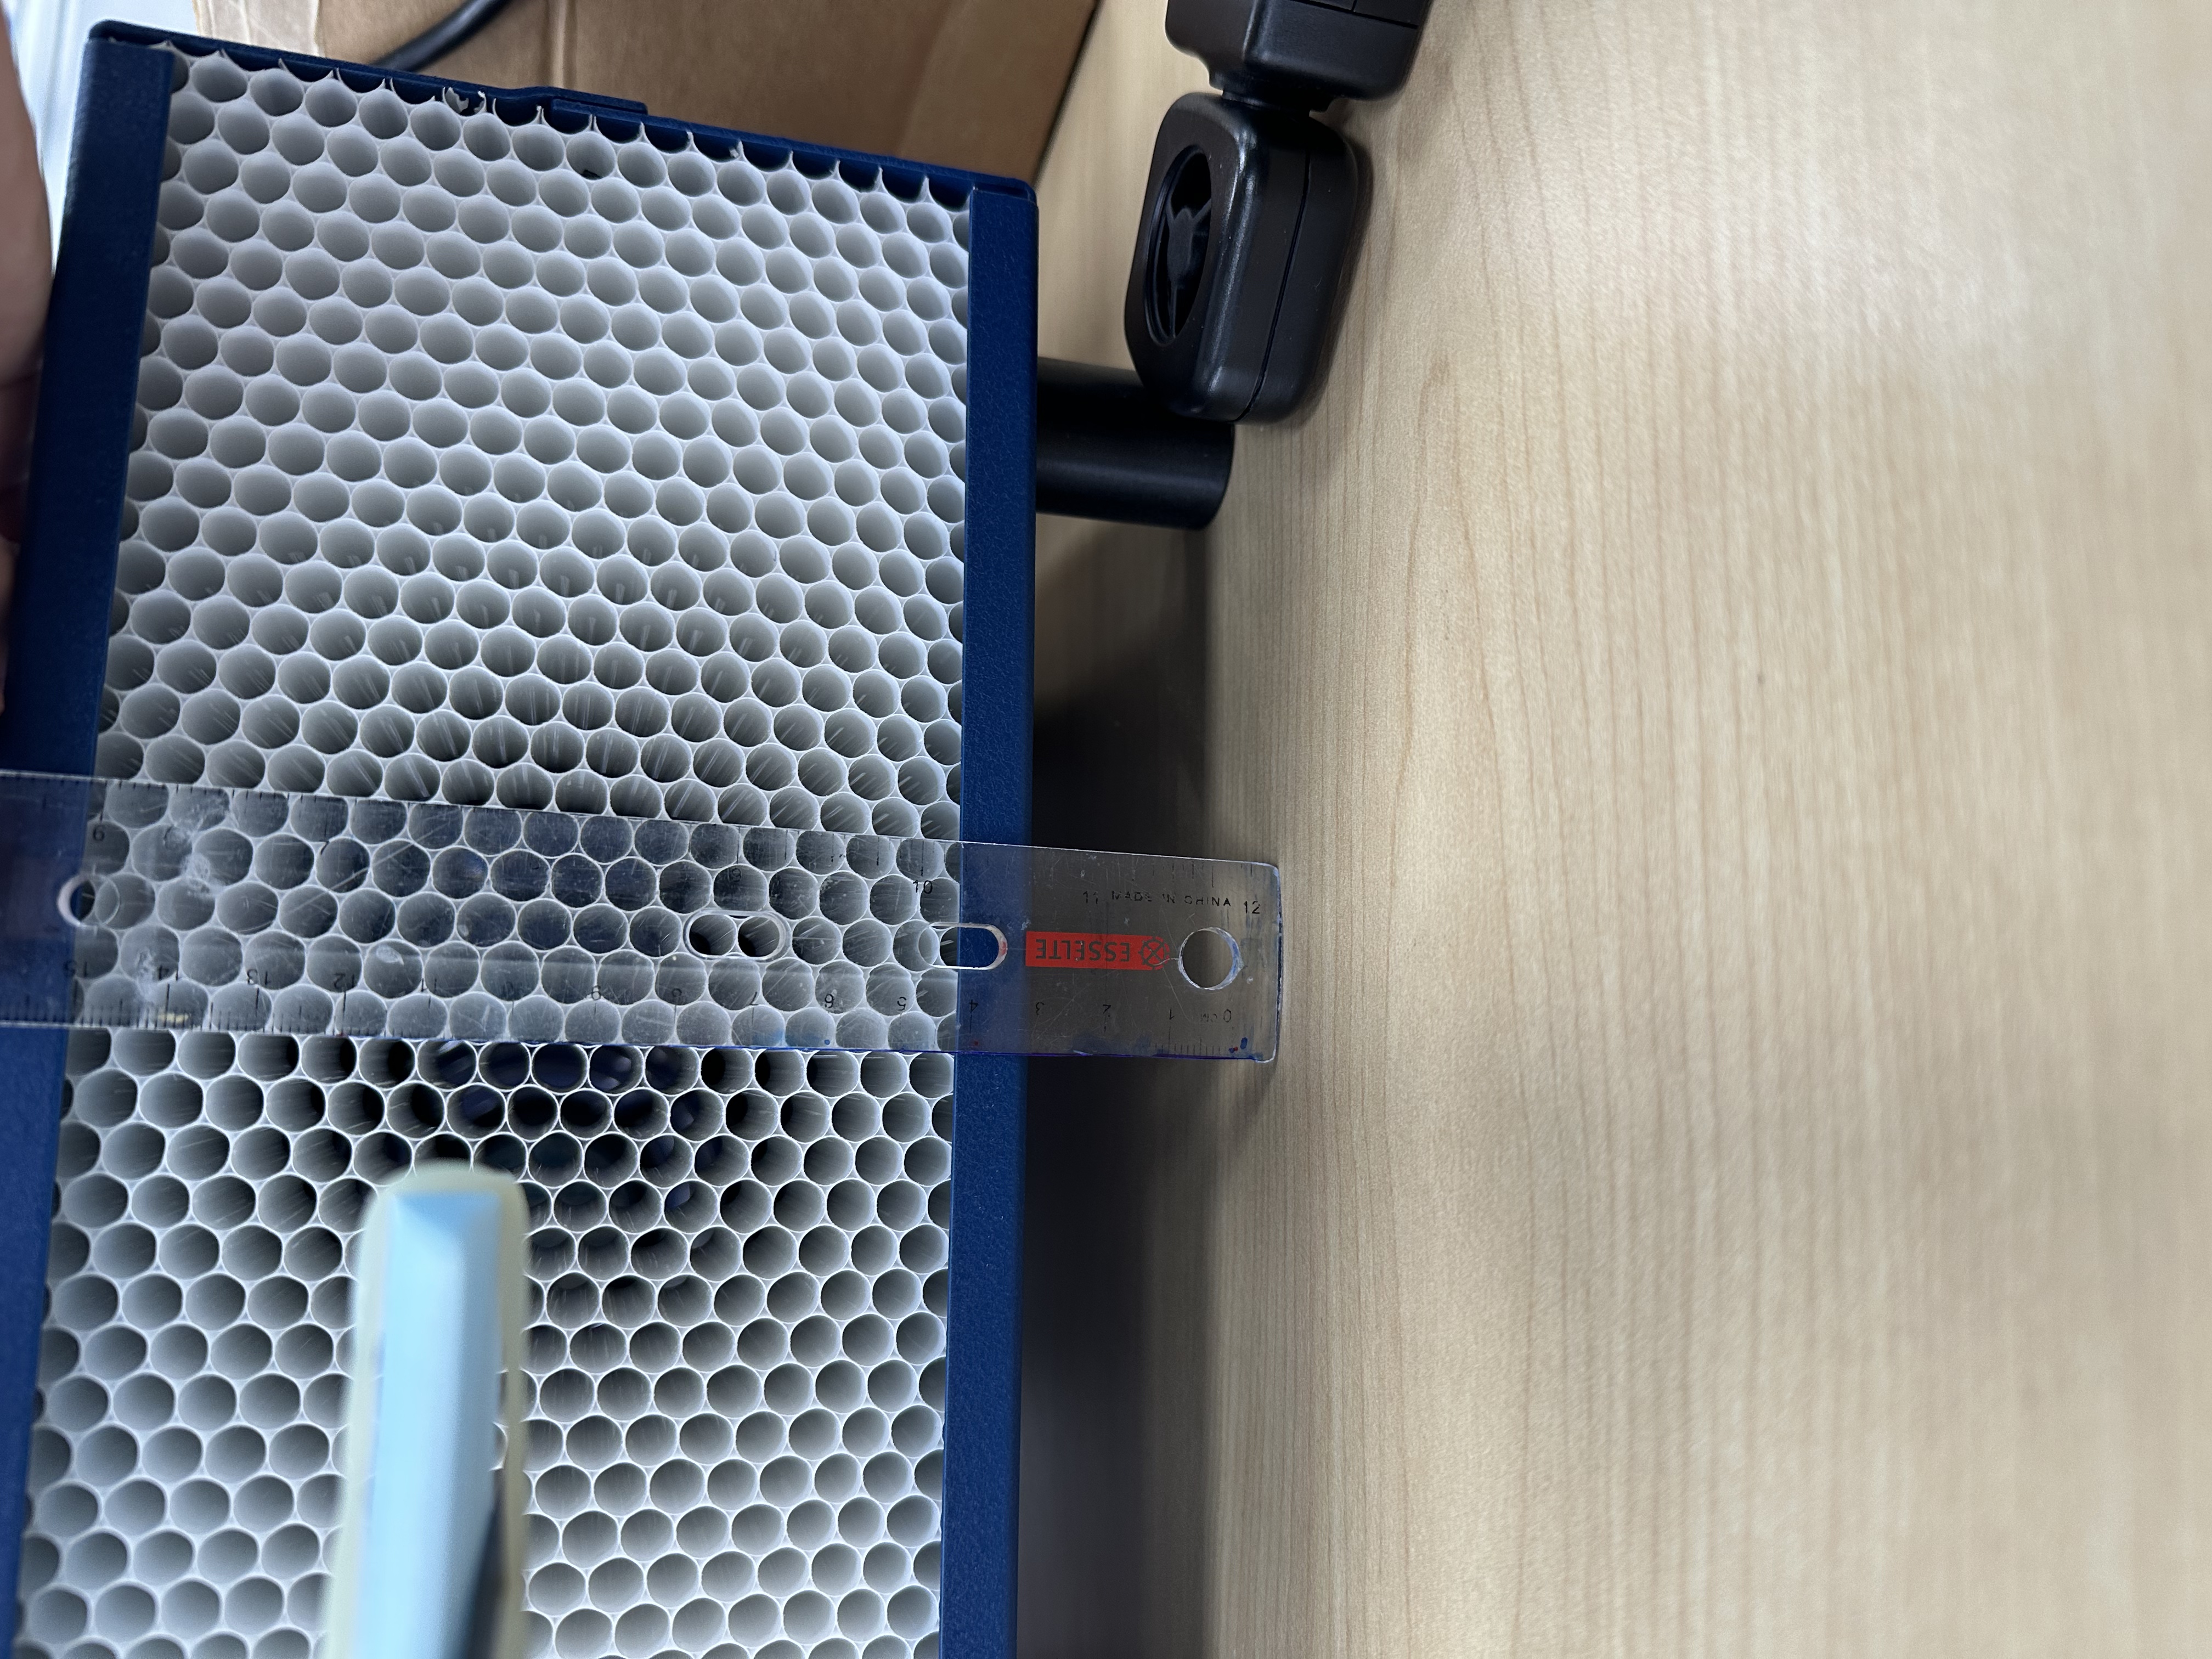
Figure 19: Height measurement with the machine turned on.
Findings and Reflection
With the tunnel running at a velocity of around 2 m/s, the airfoil at zero AOA, the airfoil experienced a significant lift. This investigation is together with the previous three parts of this progression. The paper airplane (Part 1) introduced the basic forces of flight; the unpowered balsa glider (Part 2) introduced wing shape and CG balance; the powered balsa airplane (Part 3) introduced AoA and dynamic loading. This final part is about the airfoil itself, which shows directly why a curved profile generates lift.
References
Anderson, J. D. (2017). Fundamentals of Aerodynamics (6th ed.). McGraw-Hill Education.
Lennon, A. (1996). Basics of R/C Model Aircraft Design: Practical Techniques for Building Better Models. Air Age Media.
NASA. (2014). Winglets save billions of dollars in fuel costs. NASA Spinoff. Retrieved from https://spinoff.nasa.gov/Spinoff2010/t_5.html
NASA Glenn Research Center. (n.d.). Bernoulli’s equation. Retrieved from https://www.grc.nasa.gov/www/k-12/airplane/bern.html
NASA Glenn Research Center. (n.d.). Incorrect lift theory #1 (Equal Transit). Retrieved from https://www.grc.nasa.gov/www/k-12/airplane/wrong1.html
Selig, M. S., Guglielmo, J. J., Broeren, A. P., & Giguère, P. (1995). Summary of Low-Speed Airfoil Data, Volume 1. SoarTech Publications. UIUC Department of Aerospace Engineering.